Presenting UML Software Engineering Diagrams to Blind People
The TeDUB system promises to deliver a UML diagram tool accessible to blind software engineers. The system uses a number of different interfaces and representation techniques to overcome the challenges of making diagrams created with the Unified Modeling Language usable for blind people. The system is entirely automated and does not require special preparation of UML diagrams by a sighted user. The results of evaluation of the system with thirty-six users were positive. The system was well-received and the participants were able to complete set UML tasks.
Context
Computer programming is one field where blind and vision-impaired people have been able to participate in the employment market and in education. Computer code has traditionally been text, and therefore accessible to blind people using assistive technology (i.e. screen readers). In recent years the growth of software engineering has led to an increase in the use of modelling tools that use rich visual presentation to facilitate software development by sighted programmers. These tools are visual languages that aid in the design of software systems. One of these languages is the Unified Modeling Language [5], a graphical modelling standard. It reflects the dominant object-oriented programming paradigm, and is increasingly popular in education and the workforce. UML diagrams consist of nodes and connections between them. This general model allows for twelve types of diagram, two examples of which are shown in Figure 1 and Figure 2.
These two UML diagrams illustrate the problems with presenting UML using conventional accessible solutions, such as tactile diagrams. A great deal of detailed information is contained in UML diagrams, much of it graphically, such as the style of arrow-heads on connecting lines. This imposes practical limits on UML representation in a tactile diagram [1][4]. Users are unlikely to be able to print a UML diagram onto swell paper and create a usable tactile diagram. In addition, UML is designed to be a co-operative modelling tool, a dynamic source of information for a development team to annotate, amend and change during development. To take advantage of these features interaction with the content is necessary, and the user must be able to access the diagrams autonomously and on demand.
Figure 1. A UML class diagram
Figure 2. A UML state diagram
The TeDUB project (Technical Diagram Understanding for the Blind) has been working on access to technical diagrams [3][6]. We have been working on interfaces to structured information, and have now developed a tool to access UML. This is driven by a need to maintain the ability of blind people to compete in the software engineering field. The system is fully automated, so the user can receive a UML diagram and access its contents immediately without the intervention of a sighted mediator. This is achieved by taking the output of UML design tools in a common UML interchange format, XML Metadata Interchange (XMI), and converting and re-presenting the diagram content in a manner suitable for a blind user.
Difficulties
There are a number of challenges in building a UML design tool for blind people. Some are basic technical problems, for example the inconsistent application of UML standards by different UML design tools. More significant is the problem of how to represent the large quantity of information content that is immediately apparent to a sighted user through UML's graphical presentation. Sighted people can easily identify relationships between items; easily identify the overall structure of the diagram; easily identify different levels of complexity and detail; and move easily between different views or points in the diagram. The fact there is so much information means that the content must be re-presented in such a way as to allow the blind user to process it effectively. Working item by item through the information content in an unstructured linear fashion with a screen reader will not be practical. The advantage of UML is that the information conveyed in UML graphics is explicitly defined in the UML standard, so all of the information content in the diagram is available to be presented to the user. This is very different from non-technical diagrams, where there is no agreed visual vocabulary or grammar, and the user is expected to use visual semantic knowledge to interpret the diagram. Because all the information content is explicitly defined it can be re-presented as required in its entirety.
The challenges therefore relate to how to model and present the UML information. For example, does a simple model consisting of nodes and connections between them provide sufficient structure for the information content, and how is information attached to connections to be represented and accessed?
The TeDUB approach
The re-presentation of UML information to blind users must be informed by some analysis of the information source to identify what should be communicated. UML is presented through the visual medium: what visual information is indispensable for understanding the diagram and successfully completing tasks with it?
Information rendered graphically, such as a relationship shown by an arrow, can be re-presented as a text-only equivalent with no loss of factual information. Going further, the absolute layout of the UML diagram does not convey any explicit information that is unavailable should the diagram be distorted. This does not mean that inferential information is not provided by the spatial positioning of nodes in the UML diagram. A clear and rational layout of the contents of a diagram by a sighted user will create a diagram that lends itself to easy analysis and understanding by another sighted user. While two UML diagrams might be informationally equivalent, it does not follow that they are equal in ease of use. This means there is a choice for the TeDUB project: should an attempt should be made to provide the spatial information in a diagram on the grounds that it is useful to sighted people in using the diagram, and therefore should be useful to the blind user? The layout information is likely to be of some value. The blind user may need the spatial information to allow them to cooperate with a sighted user on the same diagram. Against this proposal is the fact that communicating the spatial information (for the system) and building up a spatial mental model of the diagram (for the user) may require more effort than the benefit of gaining the spatial information warrants.
UML diagrams are based upon a connected network of nodes. The type of each node depends on the UML diagram: a node might be a Class in a Class diagram or an Actor in a Use Case diagram. While the spatial layout of nodes may help sighted users, it is the connectivity between nodes that is the important information. The task of communicating spatial information is simplified considerably if one considers that the problem is how to communicate the correct layout of nodes in the network and the connections between them, not the absolute spatial position of nodes in the diagram. A further pragmatic consideration is that the modelling of the diagram as a connected network implies some layout. The general model for the representation of UML diagrams is therefore a connected network with a layout consistent with the original diagram. However, some UML diagram types cannot be fully modelled in this way. For example, some UML diagrams allow the nesting of diagrams within nodes, such as class diagrams contained within packages. In addition, the problem of the great quantity of information in a UML diagram must be addressed. How can it best be structured?
The TeDUB solution to
these two problems is to employ a hierarchical structure that is logically
orthogonal to the connected network representation. Generally, all the nodes in
a single connected network will be children of a single parent node, which may
be a node created to structure the diagram, containing information about the
diagram/network it represents such as Class model of eCommerce system
, or a
node representing some structure within the UML model itself, for example a
package node containing class nodes. A simple class diagram, as shown in Figure
1, might be a shallow two-level hierarchy of class nodes. The state diagram in Figure
2 shows a composite state (partially filled out
) that is composed of two sub
states, which would therefore appear in the hierarchy as child nodes of the
partially filled out
node. This is a compositional hierarchy, which serves
two roles. First, it provides a way to structure multiple nodes and UML
diagrams into one UML model, as required by the UML model specification. Second,
and more importantly for blind users, it enables the system to represent
compositional bodies and high-level semantic structures in single structural nodes.
This is analogous to the sighted user's ability to recognise UML components as
parts of a meaningful higher-level whole without needing to painstakingly analyse
the function and content of every component. The blind user navigating through
the hierarchy from the top root node will encounter, before any atomic UML
component like a class node, a structural node that provides summary or context
information on the component nodes it contains. If the blind user knows that
the set of nodes that are to be encountered next are all children of a Class
model of an E-Commerce system
structural node then they may find it easier to
understand the role of each node, or identify that the children are not of
interest for task at hand and know to move on to another part of the model. The
question arises, of course, of where the semantic information used to create these
nodes is obtained. The automated TeDUB system cannot provide meaningful
descriptions like a human annotator, but nonetheless the UML model does contain
meaningful structural information and text, so these structural nodes are
meaningfully titled and typed.
Finally, although the connected-network and hierarchical models are paramount, to support different tasks and diagram types a number of special functions, views, and rules are also used by the system. These aim to facilitate specific activities, such as identifying all the actors in a use case diagram.
Styles of communication
The TeDUB system is intended to provide an accessible interface to the UML diagram content and support four of the twelve UML diagram types (class, use case, sequence and state diagrams) considered to be most useful and commonly used.
The user interface, shown in Figure 3, uses standard Microsoft Windows user interface components, such as text boxes and lists, so as to be screen-reader neutral. This allows the user to employ their usual screen reader. UML users are likely to be skilled computer users and skilled screen reader users, and quite possibly Braille users. Allowing them to use these skills and their screen reader restricts the options available to a self-voicing application (for example, locating speech output around the user) but compensates by leveraging their assumed screen reader abilities. This is combined with a number of alternative interfaces, such as spatialised sound or a tactile device (a force feedback joystick), that allow representation of the spatial information in the diagram, such as the position of nodes or the connections between them. The alternative interfaces use devices that are widely available and low-cost, such as standard sound cards or games joysticks, rather than relatively expensive special purpose devices. The system is intended to be affordable and usable without special equipment by users with their own familiar screen reader. This is important if the system is ever to be used in the real world.
The hierarchical tree structure of nodes is navigated through by the user using a Windows Explorer-style interface controlled by the cursor keys. This approach has been rated very highly in evaluations undertaken by the project [3]. Only the name and type of the current node is immediately available to the user: the user learns which nodes have children or siblings by trying to access them. Context sounds warn the user when no such nodes exist. Navigation commences at the top node of the diagram, which acts as home to the user and can be returned to at a key press if the user becomes lost. The composite structural nodes with semantic meaning are therefore encountered first, so the user can very quickly obtain a high-level understanding of the contents of a model without having to access and explore a single UML component.
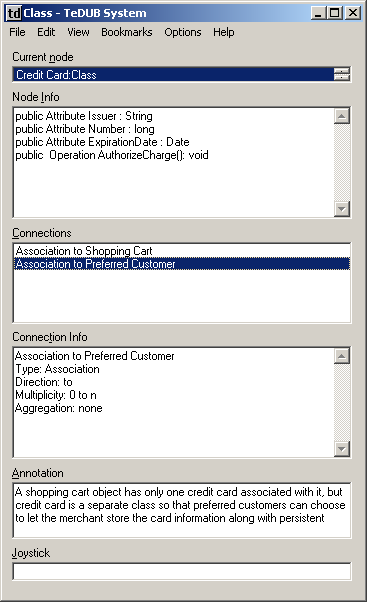
Figure 3. The user interface in action
A back function
enables the user's steps to be retraced in the same way as a web browser.
Bookmarks can be set or reset at will and accessed with a key press, so if the
user is exploring the relationship between two nodes the user can switch back
and forth between them no matter what their location in the hierarchy. All of
these features relate to navigation between nodes in the hierarchy: information
captured within the nodes, for example connectivity, annotation, and attributes
of the node, is all available with a key press and is related to the current
node. This helps to structure information so that it is only presented to the
user when the user requests it, complying with the principle of maximum
information in minimum time
so useful for screen reader users. Because content
is only accessible through the current node the user must change nodes to
access different content. This navigation requirement is ameliorated by a find
function that searches the entire tree and by a text representation described
below.
The second fundamental way to access the diagram contents is related to the representation of the diagram as a connected network. This user still has a current node, but instead of moving around the hierarchy, the user moves to nodes connected to the current node in the diagram network. This can be accomplished by selection of a connection from a list in the main interface or through use of a joystick. If a connected node lies in the direction indicated by the joystick the name of that node is presented. Spatialised sound is used to reinforce the joystick position. This is a simple system, but suffers from one major flaw in that if multiple nodes are connected and located in the same direction then they cannot be discriminated by the joystick direction alone (the system presents the closest node) since it indicates direction only as the crow flies. This means that in large diagrams it may not be possible to access every node through this interface. There might in any case be nodes not connected to any other, not represented in the network (for example top-level nodes) or different diagrams without connections between them. It follows that connection navigation does not necessarily allow the user to access every node in the diagram as the hierarchy navigation does. However, the connection navigation should allow the user to access every node connected directly or indirectly to the current node, and the current system cannot guarantee this. For this project diagrams have been selected that avoid this problem. For a real application the some rearrangement of nodes or connection directions would be required, which abandons the consistency between the blind and sighted user's view of the layout of the diagram but retains the simple node-connection model.
Some other functions and views have been added to investigate their potential. One is a function that maps the connected network representation of the diagram (or the currently-connected network, if there are several) onto the joystick area of movement. As the user moves the joystick any node at the position in the diagram corresponding to the position of the joystick is presented to the user. This allows for a quick overview of the diagram, but quickly becomes unusable as the number of items in the diagram increases beyond about twenty. Another approach allows access to the information content of the diagram by representing it as an internally-hyperlinked text-only document, which can be navigated with the cursor keys in the same way as any standard text document. This is effectively a rendering of the diagram as a linear text document, so users can use their text navigation skills and techniques to explore the content, find, cut and paste and access the information directly. There is also a set of functions based on task analysis of the types and uses of the diagrams. For example, a function provided for use case diagrams allows the presentation of only the use cases in the diagram, useful for developers checking the required use cases against implemented functions. A final approach under development is to represent the diagram nodes and connections on a tactile tablet. This is similar to previous work done on software engineering diagrams [2]. This is not a tactile diagram: rather, the nodes and connections of the diagram are accessed through a grid whose vertices along the diagonal correspond to nodes within the diagram. Connections between nodes are represented by the intersection of perpendicular lines drawn from the nodes along the diagonal.
User evaluation
The system has been
evaluated with 34 blind and partially-sighted users in a first round of
evaluation. 11 were students following a computer-related course (one a
high-school programmer) and 23 were professional users. Class, use case and
state diagrams were evaluated by questionnaire and by assigning the users
common tasks for the diagram, such as To which item or items is 'Hypothesis
Buffer' connected?
The results of this evaluation will inform the next round
of development (as have previous rounds of development in the project)
including support for UML sequence diagrams.
Results of the latest round of evaluation were largely positive: users were comfortable with the interface and completed the tasks set successfully. The simple but varied user interface features, such as the back function, were well-regarded and allowed different users to employ different strategies. A demand for diagram creation and editing functions was strongly expressed. The next stage of evaluation will use larger diagrams, since the diagrams used were small enough for users to 'chunk' or hold in memory entirely, and strategies and outcomes may well be different.
Some interesting results of the evaluation
already conducted included the following. Although a consistent alphabetical
order of nodes was presented to the users, they requested variable orders more
related to the roles of the nodes: for example, in state diagrams, state nodes
should be placed in likely order of occurrence. Whilst using the joystick to
provide connection information was successful, support will be given to using
the number key pad as a replacement. Like the joystick function, this has
problems when multiple nodes are in the same direction, but the problem is
exacerbated by having fewer directions to discriminate between the connected
nodes. The text-only view was received very positively, as might be expected
from software engineers accustomed to using computer code. One user referred to
the text-only view as the pseudo code
view.
Further development of the system based on these results are hoped to deliver a useful UML tool for blind people working in software development.
References
1.
C. Baillie, O. K. Burmeister & J. H. Hamlyn-Harris, Web-based Teaching:
Communicating Technical Diagrams with the Vision Impaired
, Proceedings of OZeWAI 2003, Bundoora,
Victoria, Australia, December 2003.
2.
P. Blenkhorn & D. G. Evans, Using Speech and Touch to Enable Blind People
to Access Schematic Diagrams
, Journal of Network and Computer Applications, ISSN 1084-0845, Vol 21, pp17-29, 1998.
3.
P. Blenkhorn, D. Crombie, S. Dijkstra, D. G. Evans, B. Gallager, C. Hagen, M.
Horstmann, G. Ioannidis, A. King, M. Magennis, H. Petrie, A. O'Neil, C.
Schlieder & J. Wood, Access to Technical Diagrams for Blind People
,
AAATE, In Craddock, McCormack, Reilly & Knops (Eds.), Assistive Technology - Shaping the Future (Proc. AAATE 2003), pp 466 - 470, 2003.
4.
J. M. Levi & N. S. Amick Tangible graphics: producers' views
in Tactual Perception, editors W. Schiff
and E. Foulkes, Cambridge University Press, Cambridge, UK, 1982, pp 417 - 429.
5. OMG, Object Management Group, OMG website, http://www.omg.org/uml, January 2004.
6. H. Petrie, C.
Schlieder, P. Blenkhorn, D. G. Evans, A. King, A-M. O'Neill, G. T. Ioannidis,
B. Gallager, D. Crombie, R. Mager & M. Alafaci, TeDUB: A System for
Presenting and Exploring Technical Drawings for Blind People
, In K.
Miesenberger, J. Klaus, & W. Zagler (Eds.), Computers Helping People with Special Needs, Proc. 8th ICCHP, Lecture
Notes in Computer Science, No. 2398, ISSN 0302-9743, Springer, pp 537 -
539, July 2002.