Re-presenting visual content for blind people
A thesis submitted to the University of Manchester for the degree of Doctor of Philosophy in the Faculty of Humanities
Alasdair Robin King, 2006, School of Informatics
Abstract
This thesis addresses how blind people access information sources designed for sighted people, and specifically the process of accessing arbitrary documents through automated processes independent of any intervention by a sighted person.
A web browser and a technical diagram access tool were developed to re-present web pages and diagrams for blind people:
- The web browser presented web pages in a linear text format that permitted blind users to utilise their familiar screen reader. Evaluation confirmed that measured against other assistive technology it was successful in allowing blind users to access the majority of web pages, including those using forms, frames and JavaScript.
- The technical diagram access tool re-presented technical diagrams, including electronic circuit and UML software engineering diagrams, as a set of nodes organised into both a hierarchy and connected graph. Evaluation of the access tool indicated that users were able to access technical diagrams through the tool and successfully complete tasks.
The two applications handled spatial and layout information differently:
- No layout information was provided in the web browser. This did not detract from its use. A simple heuristic function allowed users to identify the content of interest on a web page.
- The diagram reader presented layout and spatial information with audio and haptic interfaces, but this re-presentation did not generally assist in the successful use of diagrams. Dedicated functions that supported user goals and tasks were most successful.
The thesis concludes that for web pages and technical diagrams their layout and spatial information need not be presented to blind people. Re-presentation is more successful when it supports user goals and tasks, if necessary by analysing layout and spatial information and explicitly communicating to blind people what sighted people can infer from it.
Declaration
No portion of the work referred to in the thesis has been submitted in support of an application for another degree or qualification of this or any other University, or other institution of learning.
Acknowledgements
My thanks to everyone who has helped me, including:
- Paul Blenkhorn for his inspiring ideas and encouragement.
- Sijo Dijkstra of FNB Netherlands and the TeDUB project user groups for performing the user testing.
- Roger Wilson-Hinds for his great support and advice on WebbIE.
- The citizenry of the European Union for funding my employment.
- My wife, Jo Taylor.
- Dave Stevens and other directors at Claro Software for their support.
Above all, my most sincere gratitude goes to Gareth Evans, without whom this thesis would not have been completed.
Copyright
Copyright in text of this thesis rests with the author. Copies (by any process) either in full, or of extracts, may be made only in accordance with instructions given by the author and lodged in the John Rylands University Library of Manchester. Details may be obtained from the Librarian. This page must form part of any such copies made. Further copies (by any process) of copies made in accordance with such instructions may not be made without the permission (in writing) of the author.
The ownership of any intellectual property rights which may be described in this thesis is vested in The University of Manchester, subject to any prior agreement to the contrary, and may not be made available for use by third parties without the written permission of the University, which will prescribe the terms and conditions of any such agreement.
Further information on the conditions under which disclosures and exploitation may take place is available from the Head of School of Informatics.
1. Introduction
Sighted people enjoy access to many visual sources of information, such as newspapers, web pages, sheet music, circuit diagrams and business charts. Until recently much of this information was available only through printed paper media. These are entirely inaccessible to blind people. Instead of print, blind people use touch (haptic) or hearing (audio) equivalents. Braille is one of the oldest haptic technologies with around 13,000 users in 1986 in the United Kingdom (Bruce et al. 1991). Tape recordings and latterly computer-generated synthesised speech are more recent audio technologies and are now more widely-used than Braille.
The problem is that the vast majority (95%) of books, newspapers and magazines are never made available in an accessible format (Mann et al. 2003) and there are often significant delays before the accessible format becomes available. Production of an accessible format has traditionally required a sighted intermediary to transcribe the document, so blind people had limited control over what they could obtain.
A more recent development is the availability of information sources using electronic instead of print media, including electronic books, diagrams as electronic files and web pages. Blind people have also acquired computers and the assistive technology to use them. Blind people can use their computers to access some of the electronic formats. This process, computer-mediated transcription, has three major advantages for blind people. First, they can access information that was previously not available in an accessible format. Second, they can access it immediately (e.g. web pages) or with less delay (e.g. obtaining electronic versions of books directly from publishers rather than waiting for an audio or Braille version to be produced). Third, their access to information is now independent of sighted people. Bauwens et al. (1994) describes the process of computer-mediated transcription for publishing. A more prosaic example is that instead of waiting for an audio version of the London Times to be recorded and posted, a blind person can now access the newspaper’s website at any time and read the contents. Berry (1999) describes how blind people volunteer this as “empowering”.
These advantages apply only to computer-mediated transcription and therefore disappear if blind people are forced to rely on sighted intermediaries at any point in the process. Computer-mediated transcription must therefore be automated and it must be able to handle arbitrary documents, not documents pre-prepared by a sighted person by annotation or editing. This constrains what information sources are suitable:
1. The input format must be amenable to transcription by machine. For example, web pages are composed largely of structured text and can be transcribed relatively simply by obtaining this text and determining its structure. In contrast, automated transcription of a raster image file of a photograph into a meaningful text description (e.g. “this is a picture of a horse”) is currently impossible.
2. The information obtained in transcription must be communicated to a blind user in a way that they can use. This is the problem of re-presenting the information. A document that can be transcribed by machine may still be difficult to re-present. For example, a book is relatively simple to re-present using speech and a set of navigation controls. In contrast, the problem of re-presenting mathematical equations to blind people is very challenging (Stevens and Edwards, 1994).
This thesis is concerned with this second problem of re-presentation. There are many new information sources that can be transcribed. There are many problems with re-presenting them. This thesis describes the re-presentation of two information sources by means of actual working tools:
1. Web pages. These are hypertext documents available over the Internet, and so amenable to computer-mediated transcription.
2. Technical diagrams. These are also available in electronic formats. They may only be available as images (vector or raster) and different formats are more or less amenable to transcription. Re-presenting the outputs from the automated transcription of different formats is examined, including image analysis of bitmaps and conversion of a structured text format.
The problem of presenting structured text is relatively well-understood and addressed (e.g. by talking books (DAISY, 2004)) However, there remain problems with re-presenting visual content. This is the structure, content and meaning that is apparent to sighted people examining a document. For example, a newspaper page structures text into articles and headlines with layout and formatting. An electronic circuit diagram represents a circuit as a connected graph of elements laid out in a two-dimensional plane where grouping implies structure and lines indicate connectivity. Visual content is immediately obvious and available to a sighted person looking at the original document. Sighted people can interpret it into meaningful information with ease. Visual content can serve three functions:
1. It may be used to structure the document, as with text structured in a newspaper.
2. Visual content may structure information so that it lends itself to problem-solving of particular problems by sighted people (Bennett and Edwards, 1998). For example, an electronic circuit diagram may lend itself to solving certain problems by laying out components to make certain relationships immediately apparent to a sighted user.
3. Visual content can be content in and of itself. For example, in an architectural floor-plan diagram the visual content (e.g. shape, location and orientation) is the information content itself.
All of these functions of visual content are available to sighted people. Blind people must rely on the re-presentation of the information, which may or may not include this visual content. This gives rise to two problems:
1. The function of the visual content may be implied in the final document but not explicitly present in the electronic source. For example, web designers often code structure into the final visual appearance of a web page (e.g. make a heading centred, bold, and a larger font), not the structure of the code itself (e.g. mark-up heading content with a dedicated heading code element) making it difficult to use a web page: users have to locate an article of interest amongst all the advertisements. There are two solutions: either the function must be inferred from the visual content itself and presented to the user (e.g. identifying the headings by analysis of appearance and alerting the user) or the visual content must be communicated to the blind user directly and they must take responsibility for drawing the necessary inferences (e.g. indicating the appearance of text and leaving the user to identify the heading).
2. Communicating visual content is itself a challenging problem, with pragmatic complications (finding a usable user interface based on haptic or audio) and theoretical ones (whether blind people are actually able to use visual content presented to them). The visual content can be elided from the final re-presentation of a document, but this means that blind people would lose its structuring, content or support for problem-solving.
This thesis examines these two problems through the development of the web page and technical diagram re-presentation tools, evaluates the tools’ effectiveness, and draws general conclusions about the re-presentation of the visual content of these information sources. The motivation is to improve access for blind people to some of these sources by improving their re-presentation.
Chapter 2 classifies different information sources into types and uses this classification to identify approaches for the re-presentation of information sources according to their type. Chapters 3 and 4 describe the re-presentation tools (for technical diagrams and web pages, respectively). Chapter 5 returns to the general problem of re-presentation, attempts to draw conclusions about how to handle visual content, and identifies future work.
1.1. A note on Braille and speech
Reference to Braille use is made in the thesis, and is obviously a very important issue for Braille users. Braille users access text through a Braille line or display, which is a form of reading (in that they can scan back and forth along the line and employ other techniques including layout) rather than listening (using text-to-speech). Braille use has many important implications for re-presentation, including user interface design, the communication of layout information and how users can interact with supplementary audio output. However, Braille use is low and declining, although it is higher in the skilled and technical groups who might be expected to be the natural users of some of the tools described in this thesis (Bruce et al., 1999). Text-to-speech technology is more widely available, less expensive and increasingly the norm. In addition, Braille use is such an important and specialised topic that it would warrant its own thesis. For these reasons, this thesis focuses on blind people who use a screen reader to produce speech rather than driving a Braille display.
2. Visual content and blind people
There are many different information sources available to sighted people, such as printed text, web pages, and technical diagrams. Each type has its own conventions and representational techniques. All use visual formatting and appearance to structure information and provide semantics [1], and some provide explicitly spatial information with graphics and layout, such as floor-plans. This has important implications for the re-presentation of these information sources for blind people.
Section 2.1 outlines sight and the role of visual content in different information sources. Section 2.2 describes a classification of information sources based on these different roles. Section 2.3 describes how each class of information source might be re-presented to blind people. Section 2.4 draws this together to describe a model for re-presenting visual content and the information sources described. This will be evaluated in Chapters 3 and 4 by the development of tools based on this approach.
2.1.Sight and how information sources work
Sight is very powerful. Because of its power it shapes how sighted people record information. Sight has characteristics such as the aggregation of similar content by appearance (such as colour or shape), differentiation of content into discrete groups by locality, gestalt recognition (the ability to “see instantly” meaning and implied information), and saccading, moving the point of attention freely and rapidly across the information source in search of content of interest or to facilitate a process of understanding and inference from the document (Solso, 1995; Wickens, 1992). These characteristics give sighted users an innate ability to identify patterns, rapidly find information of interest and relevance, infer relationships and perform other problem-solving and information-retrieval tasks.
Information sources contain content which can be broken down into two types:
· Symbolic content is information that is conveyed by means of characters and other symbols. Paragraphs or text labels are examples of symbolic content. Symbolic content also includes defined graphical signifiers for which a text replacement is informationally-equivalent: this is common in technical diagrams, where (for example) an OR Gate in a digital electronic circuit is consistently represented by a defined signifier.
· Visual content is information that is not conveyed through symbolic content but through visual appearance, such as layout, shape, orientation, and position. It is used to structure symbolic content (e.g. splitting a newspaper page into stories with headings), to provide semantics (e.g. emphasis, as in “I am really unhappy”) and can also be content in and of itself where it directly presents spatial information (e.g. a scale drawing of a floor-plan).
Blind people can access the symbolic content of an information source through speech in a straightforward manner. Text and the text equivalent of any signifiers can be read out. The re-presentation of symbolic content by speech is linear and sentential: words follow each other in a single sequence in time. By contrast, blind people must rely on some spatialised audio or haptic interface to access visual content, because visual content is non-linear and not sentential. For example, the arrangement of components in a circuit diagram has spatial, proximal and positional information in addition to the symbolic content of the components themselves. There is no direct and obvious sequence for the components in which they should be presented in speech. Some re-presentation approach is required [2].
Visual content and problem-solving
Visual content has a role beyond recording information. Larkin and Simon (1987) observe that two-dimensional presentations of information allow the information to be indexed by a two dimensional location. Larkin and Simon’s work, and later work by Koedinger (1992), Kulpa (1994) and Barkowsky (2001, 2003) is based upon the reasoning that these two-dimensional presentations, or diagrams, are effective for sighted people because diagrams are more computationally efficient than sentential representations with the same information content as a result of the localisation of information in the diagram. They regard the visual representation of information as a tool for a process of problem-solving and state that diagrams are therefore more efficient. Zhang and Norman (1994) expand this approach to two-dimensional visual representations in general, finding that different representations have an important influence on the problem-solving process users chose: the visual presentation of a problem can change the way that sighted people approach solving it and their success or failure. For example, Green and Petre (1996) examine the effects of different representations of programming problems in different software engineering approaches and identify different effects on problem-solving.
Bennett and Edwards (1998) took this work and applied it to the problem of diagram use by blind people. They observed that diagrams are not always more effective for sighted people, as demonstrated by Green and Petre’s study (1992) of visual programming languages. This found that the symbolic presentation of code was more effective for solving some problems. There is therefore no automatic superiority of visual presentations over symbolic ones. However, Bennett and Edwards argued that diagrammatic representations are effective when they allow problems to be solved more easily than sentential representations of the same information. More formally, two representations with informational equivalence may have different computational efficiency for a given set of user tasks. Diagrams help sighted users to perform certain tasks easily, and Bennett and Edwards suggest that communicating this spatial layout to blind users was necessary because only when they experienced a similar profile of computational efficiency would they be able to use the diagrams effectively. If a diagram favours a task for a sighted user, then it must also favour that task for a blind user.
Blind people and spatial layout
Visual content takes many components, but the most important in the studies reported above and in the information sources to be examined is spatial layout. If blind people cannot use spatial layout then there is no purpose in presenting it to them. There is considerable evidence to support the proposition that blind people have sufficient spatial ability to use spatial information, although they have to employ deliberate strategies to do so where sighted people might do it without conscious effort. This evidence is largely derived from the investigation of navigation and maps. Ramsay and Petrie (2000) describe how movement and relative positioning could be communicated successfully to blind people. Ungar et al. (1996) found that blind children can navigate with maps they can feel using landmarks. Later work (Ungar et al. 1997) indicated that blind children can also judge distances from maps, though not as well as sighted children. Millar (1994) in detailed studies of blind children supported the position that blind people have the ability to make use of spatial information. It does appear that spatial layout can be made use of by blind people, although Kitchin and Jacobson (1997) criticise the validity of previous investigations into geographic space.
2.2.Information sources that might be presented
The huge range of information sources necessitates some classification of what is to be addressed in this thesis. A complete taxonomy of diagram types is a philosophical problem and a daunting task: an attempt is made in Massironi (2002), but for this thesis information sources are divided into three types: textual, diagrammatic, and pictorial. These are descriptive titles, not prescriptive statements about content, but the three types have different characteristics that necessitate different approaches.
This classification is not exhaustive, and does not include several important types of document, such as musical notation and mathematics. This is a pragmatic decision to exclude information sources that have their own, specific problems for translation into an accessible format (e.g. e.g. McCann 2001 for music; Gardner et al. 1998 for maths)
2.2.1. Textual information sources
The first information source type is textual. Textual information sources are composed mainly of linear and sequential symbolic information. Examples include newspapers, books and web pages (Figure 1 and Figure 2). Visual content is used to convey structure, for example paragraphs and subsections in books, and semantics, for example identifying newspaper headlines by their appearance. Some restructuring and representation is often desirable to facilitate use of the information sources by blind people, for example allowing a user to browse newspaper article headlines before accessing article contents.
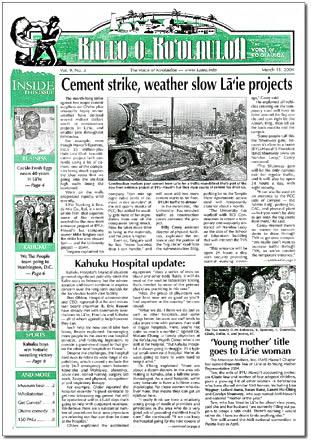
Figure 1: a textual information source, a newspaper. From http://www.kaleo.info/. It contains images for illustrative purposes: they are not generally necessary to understand the document.
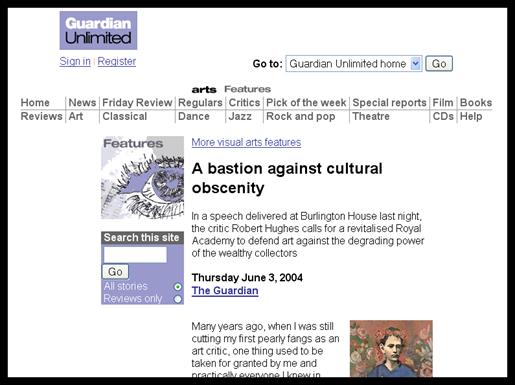
Figure 2: A textual information source, a web page (from http://www.guardian.co.uk).
2.2.2. Diagrammatic information sources
The second information source type is diagrammatic. This type includes electronic circuit diagrams and software engineering diagrams such as Data-Flow Diagrams and Unified Modelling Language (UML) diagrams (Figure 3). These are all examples of the diagrams defined by Simon and Larkin (1987). Diagram information sources are composed of symbolic content located in a two-dimensional plane, where connectivity is important and meaningful but spatial position, either absolute or relative, does not generally have any explicit or implicit meaning. For example, Figure 3 shows the same diagram with two different layouts: however, the information content is the same. Diagrammatic information sources have a standard grammar and vocabulary of diagram components, differing between domains, so any symbolic content can be translated into text with no ambiguity. All of the information in the content is therefore amenable to translation into text, which can then be communicated to the blind user. The symbolic content in diagrammatic information sources is generally constrained to nodes in a connected graph. The edges between nodes represent relationships between elements in the diagram. The spatial layout presents the contents clearly for sighted people (e.g. nodes should not overlap; edges should be clearly distinguishable from each other).
Spatial relationships embodied in these diagrams can be hierarchical: sets of nodes can be regarded as single entities at a higher level of abstraction. There are conventions for representing this, usually implicitly by grouping the nodes close to each other and away from other nodes.

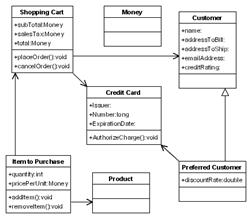
Figure 3: Two representations of a diagrammatic information source, a UML diagram (from OMG 2004). The different layouts do not change the information content.
2.2.3. Pictorial information sources
The third and final information source type is pictorial. Pictures utilise pictorial, graphical and text elements composed in a two-dimensional plane, just like diagrams. However, in pictorial information sources, visual content does not structure or supply semantics but is itself content, and it is not convertible into text like graphical symbols in technical diagrams. Examples include maps and architectural floor-plans (Figure 4 and Figure 5). In diagrams connectivity is important but not layout. In contrast, in pictorial information sources layout, shape and position are all important.
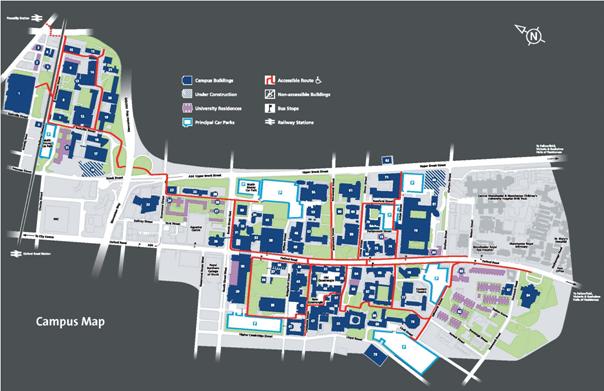
Figure 4: a pictorial information source: a map. From http://estatesoffice.man.ac.uk

Figure 5: a pictorial information source: a floor-plan. From http://collegenine.ucsc.edu/apartments.shtml.
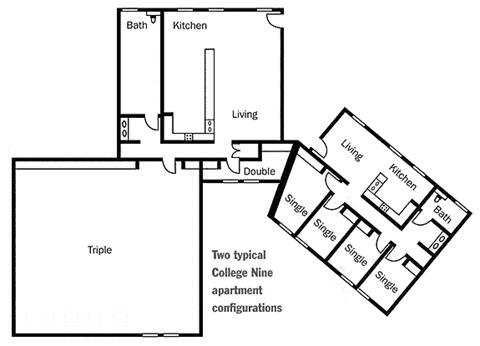
Figure 6: The floor-plan from Figure 5 with the spatial layout altered. Unlike the change in layout shown in Figure 3, this does change the information content of the information source.
2.3.Re-presenting the different information sources
Blind people have to have access to re-presentations that support problem-solving and particular tasks. This support is provided by visual content, notably spatial layout. Each class of information source uses spatial layout differently. The different tasks and roles for spatial layout mean that the different information sources must be re-presented in different ways.
2.3.1. Re-presenting textual information sources
Textual information sources use visual content for structuring the information and applying semantics to symbolic content. Re-presenting textual information sources is therefore relatively straightforward. Bodies of text can be communicated through speech. It is customary to provide some simple navigation, such as chapter and section for books, or division into stories and sections for newspapers. These are provided by simple hierarchies and linear lists of headings or indices. This is intended to improve comprehension (e.g. Truillet et al., 1998). For example, audio cassette recordings simply feature recordings of the source spoken by a person and state the headlines or chapter information. Different sections are indicated by periods of silence or by mapping the document to the physical tapes (e.g. one chapter per tape for an audio book) [3]. The DAISY system (DAISY, 2004) provides documents as multimedia Digital Talking Books (DTB). Each DTB contains some combination of audio recordings and text equivalents. The text equivalents can consist of anything from a simple title (to allow the book to be identified) to a table of contents or index, to a complete transcript of the audio recordings. DTBs can even consist only of electronic text, allowing the DTB content to be accessed by text-to-speech or Braille or through playing the audio recording. Synchronised text and audio allows users to search the text and hear the results in audio and the structure provided by the text allows the user to navigate around the DTB.
Publishers have established routes for distribution of their content in these accessible formats to a blind readership. These have traditionally involved the distribution of audio tapes or Braille. Modern technology has permitted new distribution methods. Bormans and Engelen (1998) describe how the Flemish newspaper De Standaard is delivered to readers daily by floppy disk or email as a structured document read by special reader software. The Talking Newspaper Association of the United Kingdom (TNAUK 2004) provides a similar service. Despite these developments, most printed information is not available to blind people through Braille or audio. The RNIB estimates that 95% of published material in the UK is never produced in an accessible format (Mann et al. 2003). What is available may not be available in every accessible format (Lockyer et al. 2004). The prospect of access to print information via electronic distribution over the Internet of print documents in their original electronic forms is an exciting one, although one beset by economic and legal issues (Music Publishers Association 2001, Mann et al. 2003).
There is one textual information source that is widely available and potentially accessible: web pages on the World-Wide-Web. Access to billions of web pages is a great opportunity for blind people. However, there are numerous complications. The subject of access to the Web by blind people is covered in depth in Chapter 4. However, it is important to note that although each individual web page is a textual information source the Web as a whole is not. The Web consists of a corpus of documents which must be navigated and searched to identify documents of interest to the user. This is analogous to files in a file system, nodes in a graph or books in a library. Users of such corpora often employ information foraging techniques, the process of finding a document of interest (e.g. the process of finding a web page with a recipe for chicken soup) described in Pirolli and Card (1999). Users typically examine many documents, assessing the usefulness or relevance of each before deciding whether to read and digest it or move on to try another document. Different techniques can be employed depending on such factors as how easy it is to obtain another document (very easy on the Web), the ability of the user, and the nature of the information being sought. Supporting this behaviour is important for any system that presents textual information sources with multiple documents. However, it is not important to provide a spatial representation of the Web when doing so, although it has been attempted (Chen and Czerwinski, 1998). Sighted users handle web navigation without an explicit spatial presentation, implying that blind people will not be disadvantaged by a lack of such a presentation. [4]
The structure and semantics of a textual information source may have to be determined from the visual content if it is not available in the textual information source itself. For example, web pages should explicitly identify headings that define the page’s structure, but if headings have not been provided then the structure of the page may have to be extracted or inferred from the visual content of the web page. However, this is the extent that the visual content influences the basic process of extracting and re-presenting the text content. There is no need to provide the visual content itself to blind people because it does not itself provide any information. For example, in Figure 1 the position of the three articles on the page is not material. The fact that there are three articles, and the headlines and body text, is material and useful. This structure is obtained from visual examination of the newspaper, but could easily be presented without any visual content to a blind user, e.g. “Kaleo newspaper. Three articles. Article 1, Cement strike, weather slow La’ie projects. Article 2, Kahuhu Hospital update…”
2.3.2. Re-presenting diagrammatic information sources
Diagrammatic information sources have an additional consideration: the visual content of the information source, in this case spatial layout. This may help sighted users to problem-solve: it is not explicitly part of the information content of the diagram in the way that connectivity information is. There are three ways to handle the spatial layout:
1. Remove the spatial layout. The first approach is to ignore spatial layout. For example, the UML diagram shown in Figure 3 might be re-presented as a set of hypertext pages with the connections forming links between them. The location of each node in the connected graph need not be communicated to the user. Only the connectivity information needs to be provided. The information source can be communicated in an accessible format, probably a structured text presentation. This means that any benefit that sighted users gain from knowing the layout of the items in the diagram is unavailable to the blind user. Connectivity must still be presented but as lists of connected nodes. A system that took this approach and presented technical diagrams (software engineering diagrams) without attempting to present the spatial information of the original diagrams is described in Blenkhorn and Evans (1994). It was found to be effective in Petrie et al. (1996). The advantage of this approach is that it does not require any special audio or haptic interfaces and attempts to communicate the least information. This may be more effective for blind people who can ignore the spatial layout and get on with working with the diagram.
2. Communicate what the spatial layout means. The second approach is to take into account what the spatial layout means, if anything, and communicate this information rather than the spatial layout itself. For example, certain combinations of elements in electronic circuits create higher-level aggregate elements. These aggregated elements might be identified and communicated to the user, although the process of identification is likely to be difficult: Chapter 3 describes an attempt to do this for electronic circuit diagrams, where structure was communicated by a re-presentation of the elements in a compositional hierarchy. This involves presenting the user with more complex information than removing the spatial layout entirely, but does not have to involve special audio or haptic interfaces. It may of course be more efficient than removing the spatial content because the added structure may help the user to make sense of and use the diagram.
3. Present the spatial layout to the user. The third approach to handling the spatial layout is to communicate it to the user directly. This can be done in many ways, many of which require special equipment such as spatialised speech or sound or the use of force-feedback devices. The spatial layout can be communicated either absolutely, maintaining the position of elements in the re-presentation relative to their original positions within the printed area of the diagram, or relatively, maintaining the position of each element relative to each other but ignoring their absolute position. Absolute positioning provides a convenient frame of reference, but may require more information to be provided. In general the choice between absolute and relative will be made according to the requirements of the information source being re-presented and the interface developed. For example, an interface might provide spatial information by means of an absolute coordinate system. However, for diagrammatic information sources the absolute position is not important while the relative position of elements is important. Spatial layout is used to define and structure, not important in and of it: the positions of elements are important in that they relate to each other, not how they relate to the containing diagram. This is the solution most likely to present the user with a complex audio or haptic interface to convey the spatial information. This may be difficult and inefficient, so there must be a reason to attempt it.
Spatial layout: the implications for problem-solving
Spatial layout is used in diagrammatic information sources to perform basic structural and organisational roles. For example, white space is used to differentiate articles or newspapers, and proximity is used to indicate label attribution in diagrams. However, the spatial layout in a diagrammatic information source might also contribute to problem-solving by sighted people. For blind people to take advantage of the spatial layout they must be able to obtain and retain some of the spatial information provided by the diagram from the spatial re-presentation presented to them. For example, if the re-presentation involved learning the diagram layout through spatialised sound effects, they must be able to use these sound effects to build some kind of mental map. Having built a mental map, a blind person might be able to use it for problem-solving in a similar way to the mental map built by a sighted person.
Assuming that these two requirements can be met, the spatial layout for a diagram may be of use for a blind person. It follows that while building a mental map should not be required to use an information source (so a user should be able to retrieve a poem from of a book by text search without having to remember the chapter structure) the creation of a mental map should be facilitated.
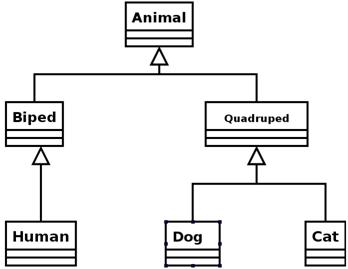
Figure 7: A simple diagram (a UML Class diagram)
The three approaches to spatial layout in diagrams might each have different effects on the development of a mental map:
1. Removal. Ignoring the spatial layout in the diagram forces the blind user to construct a mental map in isolation from the spatial model represented by the visual presentation. The mental map will reflect how the diagram is presented to the blind user, not its original spatial layout. For example, if a diagram is presented as a list of elements, then the blind user’s mental model will be a list. This does not support the problem-solving attributes of the original diagram. For example, a re-presentation of the simple diagram in Figure 7 might simply provide the elements in an alphabetically-ordered list with connections between them noted: a sighted person, however, can clearly see that the diagram has a hierarchical structure, and that the Animal class is at the apex of it. A sighted user may more easily solve problems related to the relationship between the classes with this knowledge.
2. Communication of the meaning. Providing the meaning of the spatial layout of the diagram should create a mental map with informational equivalence. For example, Figure 7 might be re-presented as a hierarchical tree such as that found in Windows Explorer, with the Animals class at the top. If it is assumed that this mental map is the same as the mental map of the sighted user, then this may be an efficient re-presentation of the information. If, by obviating the need to build the map, this removes the process by which the map is developed, then the blind user loses any benefit. For example, if the benefits of recognising the hierarchical structure of Figure 7 are only obtained if the structure is committed to a mental map, then providing this structure without requiring the user to learn it is of no benefit.
3. Presentation of the spatial layout. For example, the user might be provided with the spatial layout of every class in Figure 7 through an audio or haptic interface. Communicating the actual spatial layout assumes that the blind user builds up their mental map in the same way as the sighted user. If this is true it may result in a better mental map than that inferred that may be more effective at problem-solving. This assumes that the layout of the diagram is designed for problem-solving: that the map that the blind user builds up is also problem-solving: and that the user is able to problem-solve with it.
The basis for presenting the spatial layout to the user is therefore the assumption that a spatial layout provides a better mental map and therefore understanding of the diagram and support for problem-solving than the simpler approaches of removing spatial layout or communicating its meaning. This will be examined in Chapter 3.
2.3.3. Pictorial information sources
Pictorial information can be presented directly by a tactile diagram. These are sheets of material embossed with raised lines, characters and textured areas which allow the user to feel the content and explore it by touch. Braille embossed on the material presents text. Tactile diagrams can maintain the absolute spatial and positional information content of the printed version. For example, if a floor-plan diagram depicts a room in a certain position and with a certain shape, this can be perceived directly by feeling the room on the tactile diagram [5]. A tactile diagram showing the Microsoft Windows ’95 operating system desktop is shown in Figure 8.

Figure 8: A tactile diagram, showing Braille used for text. From 'Windows 95 Explained: a Guide for Blind and Visually Impaired Users', by Sarah Morley 1997, published by the Royal National Institute of the Blind, UK. Used with permission.
Tactile diagrams have a long and successful history, having been produced by charities and organisations for Braille books and educational materials for many years (for example, Cote et al. 2004.) Metal and plastic diagrams are used for permanent diagrams. Paper has been used as it is cheaper and paper diagrams are easier to produce in large quantities, though it does not wear as well. A recent innovation has been the introduction of swell paper, a type of paper that when heated swells in size (National Centre for Tactile Diagrams, 2004). This can be printed on by a normal desktop printer in black ink, and when passed through a heating machine the black-printed areas absorb more heat and swell. This allows blind users to produce tactile diagrams independently of sighted intermediates quickly and easily. However, this assumes that a tactile diagram created without any sighted intervention will be usable, and it probably will not. Documents for sighted people contain a great deal of information: many objects, much text, lines and shapes in abundance. While sight can discern and resolve these easily, a straight tactile diagram of the same document is likely to be impossible to understand because tactile resolution is poorer than visual resolution (Sekuler and Blake, 1992). Non-Braille text from the original will almost certainly be unintelligible, too small and unclear, and graphics will be impossible to identify or resolve. For these reasons, tactile diagrams for books and reference materials have generally been specially redesigned and converted by sighted people according to guidelines developed over many years. Levi and Amick (1982) discuss the production of tactile diagrams. Experts in the field, they state that “figures cannot simply be magnified and copied verbatim (sic) as raised-line drawings. The process of translating a visual picture into a tactual representation, no matter how it is produced, requires interpretation”. They also state that not all diagrams are suitable for conversion into tactile diagrams and give production guidelines, for example: important parts of the diagram must be carefully delineated by being rough or highly embossed; all lines must be separated by 6mm lest they merge; shapes such as arrowheads are hard to recognize if they are less than 13mm square, and small triangles or shapes often go unrecognized; 6mm is needed for each Braille cell. These figures are for higher-resolution plastic, not paper. All these factors militate against an automated method for turning complex graphics into tactile diagrams without human intervention by simply printing them on swell paper. Aldrich and Sheppard (2001) provide more recent information on the use of tactile graphics in education, TAEVIS (2002) gives modern production guidelines, Berla (1982) adds information on the vital role of diagram producers and teachers, and Horsfall (1997) and Wild et al. (1997) give updates. All stress the vital role of good tactile diagram design and translation to create a usable tactile diagram. There is no automated process for automatically producing tactile diagrams directly from print diagrams.
Another approach is to use a tactile diagram in conjunction with a tactile tablet, a touch-sensitive panel on which the tactile diagram is laid. The tablet is connected to a computer that relates locations on the panel to locations in the diagram. The user can then explore the tactile representation of the diagram and have supplementary information, for example what text lies at the current position indicated by the user, presented by the computer. For example, if a user is exploring a map of Europe, they might press on the raised dot indicating Paris and hear a description of the city read out by the computer. This approach provides a reproduction of the original spatial and positional information but allows more information to be placed on the diagram than would be permitted by Braille on the paper. The first system of this type was the NOMAD system (Parkes, 1988), later developed into the Tactile Audio Graphics (TAGraphics) system (Parkes 1994, Parkes 1998). This is commercially available (TGD 2004). Further examples of this type of system in use include Fanstone (1995), who describes a system used to present a university campus map, the TACIS system described by Gallagher and Frasch (1998), the Talking Tactile Tablet (Touch Graphics, 2004) and the DAHNI interface developed in the ACCESS project (Petrie et al. 1997). However, all of these systems suffer from the same problem: they require sighted intervention and expertise to create truly useful diagrams. In the NOMAD-style systems, this might involve creating an electronic representation of the diagram rather than re-drawing the diagram, but the work is required all the same [6].
The Science Access Project described in Gardner and Bulatov (2001) illustrates a possible automated solution, which is to use not raster bitmap graphics, which require analysis and annotation by sighted people, but vector-based formats which can be rendered for sighted people but are also amenable to automated transformation. For example, the system described by Bulatov and Gardner is intended to use files in the Scalable Vector Graphic (SVG) format (Ferraiolo et al. 2003). SVG files can name graphical items in the diagram, and explicitly define their position and area. This means that it might be possible to transform the map automatically, for example mapping the diagram area on to the tactile tablet area and providing meaningful content for each point. However, it does rely on SVG authors to comply with the format’s accessibility features (McCathieNevile and Koivunen 2000). Since the annotation and structure that would make SVG files amenable to automated translation is not required for meaningful visual rendering it is probable that most files will be inaccessible: Chapter 4 describes the low rates of use of similar structural and accessibility features in HTML. The approach will only be productive if more proprietary data formats move into SVG-like formats and applications that generate SVG produce meaningful and accessible content. As it is, Bulatov and Gardner’s latest research appears to instead concentrate on the navigation around a bitmap image using a system that is predicated on the frequent and simple production of tactile diagrams and their careful exploration, rather than extraction of the content of the diagram and its re-presentation (Gardner and Bulatov, 2004). SVG was used by Campin et al. (2003) as the data format to store tactile diagrams (maps) but these files were not generated from original SVG sources obtained from sighted people but created by hand by sighted people with the intention of supplying them to blind people.
Alternatives to tactile diagrams
All of the interfaces described above assume the use of tactile diagrams or a tablet interface to allow users to directly access a representation of the diagram that is spatial, so there is an a priori justification for claiming that the visual content of the original diagram is preserved and that the blind user may build up a mental model of the diagram that is consistent with that of a sighted person. In contrast, other systems attempt to present the visual content through spatialised audio, haptic devices such as joysticks, or text descriptions, and these will work only if blind people can synthesise the results into a coherent mental model. If this can be accomplished then the problem of creating tactile diagrams that work is avoided, so it may be easier to create an automated system.
The challenge for such a system would be how to handle the visual content without tactile diagrams. Yu and Brewster (2002) describe one such system for presenting simple bar charts using a joystick and audio and evaluated it against tactile diagrams. The results suggested that the audio-haptic system was at least comparable to the tactile diagrams for this restricted and simple type of diagram. However, visual content plays a more important role in pictorial information sources that it does in diagrams, since it does not simply structure and assist problem-solving but also provides content in and of itself, such as layout and shape in a floor-plan. The difficulties of re-presenting such visual content to users suggests that no pictorial information source will be suitable for automated re-presentation, but that the task should be left to tactile diagrams. If, however, maps and floor-plans are compared, it will be observed that although they are both pictorial information sources they are quite different in the spatial information they contain. While maps generally consist of elements freely positioned in two dimensions, or unbounded, floor-plans are bounded: they generally consist of a set of restricted areas (rooms) with connections between them (doorways). Floor-plans therefore might be re-presented as a connected graph, just like a diagrammatic information source, where the rooms are nodes and the doorways edges. Figure 9 shows an attempt to depict the floor-plan from Figure 5 in this manner: the unnamed hallway has been split into two nodes to represent the shape and spatial layout of the floor-plan. The connectivity between rooms can be preserved. The studies on spatial information and blind people found that blind people used landmarks for navigation, which fits in with this model if each room is seen as a landmark. This is of course a great simplification of the content of an architectural diagram. Such a model would be useless at depicting shape and orientation, for example. However, there may be uses for such a system, such as gaining an understanding of the connections between rooms in an office or being able to structure a tour of a museum around the layout of rooms, and it can conceivably support a process of automated re-presentation without a sighted intermediary.
Figure 9: Part of the floor-plan from Figure 5 depicted as a graph of nodes.
2.3.4. Lessons from re-presenting GUIs
Two approaches have been described that attempt to provide blind users with the benefits of visual content: communicating the structure and meaning provided by visual content or presenting the visual content as it stands. This has parallels with different approaches taken by screen readers in the past. The increased use of Graphical User Interfaces (GUIs) in the 1990s, replacing command-line-driven systems, led to fears that blind people would be excluded from using computers since they were unable to use the increasingly-common point-and-click windowed graphical environments [7]. One approach to this problem was to attempt to communicate the visual content of the environment – windows, buttons, controls, and their position on the screen. Schwerdtfeger (1991) describes several such systems, such as OutSpoken for the Apple Macintosh and ScreenReader/PM for the IBM-PC, which required the blind user to operate a mouse and read the GUI component at the current mouse position. The PC-Access system described by DuFresne et al. (1996) took a similar approach, arguing that blind people use spatial information in handling real objects – for example, ordering diskettes, placing things in certain positions and remembering these locations – and so user interfaces should be based on such positioning. Mynatt and Weber (1994) describe another such system, the GUIB system. However, they also contrast it with a system called ‘Mercator’ (Mynatt and Edwards, 1992). Mercator does not attempt to present the visual content, but re-presents the interface as a hierarchically-organised set of user interface components accesses solely thorough the keyboard and sound/Braille display. Edwards et al. (1995) provide a theoretical basis for this approach, describe how the GUI can be represented as a system of hierarchically-organised affordances, a task-based representation designed to support work with the system rather than describe how the system appears to a visual user. In fact, this re-presentation of the GUI as a set of components that can be navigated between with the keyboard and without regard to their actual spatial position is generally the approach taken by modern screen-readers [8]. Communicating the visual content was found to be less efficient than communicating what it implied (e.g. “disabled text box” rather than “wide grey text box”).
It is difficult to argue that one approach (re-presentation) has been successful, and one approach (presenting the original visual layout) unsuccessful, since this depends on so many factors (e.g. the cost of non-standard devices employed in the latter, such as tactile tablets and force-feedback mice, or the creation of a commercialised product from the research products). However, it is not unreasonable to observe the greater success of the re-presentation approach adopted by screen readers, and to suggest that this supports re-presenting the meaning of the visual content rather than presenting the visual content itself.
2.4.A model for re-presenting visual content
This section tries to create a model for re-presenting visual content, based on the research and technology described above, where the aim is to support automated processes of translation free of intervention by sighted people.
Visual content in information sources is used for different things, including providing structure and meaning and allowing sighted users to perform some tasks more efficiently (problem-solving). Studies indicate that blind people can build spatial mental maps, so communicating spatial layout might be of benefit to users if it allows them to build up these mental maps or supports problem-solving. The importance of visual content varies according to the class of information source.
Different information sources therefore require different approaches:
· Information sources that are primarily textual (e.g. web pages) should be re-presented as linear text. Structure and semantics should be inferred from the visual content and applied to the structure and content of the re-presentation.
· Information sources that are diagrammatic (e.g. electronic circuit diagrams) should be re-presented as a set of nodes. Any implicit information from the diagram (e.g. aggregation components) should be represented explicitly where possible. It is also reasonable to present the spatial layout of the diagram, with the goal of assisting blind users to build up a mental model and as a way to re-present the diagram content effectively.
· Pictorial information sources (e.g. maps) should be presented in a directly spatial format, using a tactile diagram. However, it is worth investigating whether modelling a bounded pictorial information source (e.g. a floor-plan) as a diagram (i.e. as a graph) is of benefit.
Chapter 3 describes an investigation into the re-presentation of a diagrammatic information source, technical diagrams, and a bounded pictorial information source, floor-plans. Chapter 4 discusses the re-presentation of a textual information source, web pages. Chapter 5 draws conclusions from both these investigations and relates their findings to this general position on the re-presentation of visual content to blind people.
3. A diagram access tool
A model for the presentation of diagrammatic information sources to blind people was described in Chapter 2. The principles are as follows:
· The information content of such sources is largely text, structured by layout and position.
· Graphical content has direct text equivalents.
· Re-presentation of the information source can be accomplished by communicating the text content and explicitly providing the structure implied in layout and position.
The spatial information in the diagram may still be of interest to a blind user, because the layout may assist in understanding the diagram or afford the resolution of particular tasks. However, there is a trade-off for the blind user because determining spatial position or layout is not as easy as for sighted people. Blind users should be presented with spatial information if the benefit of obtaining the spatial information is greater than the cost of the effort required. The benefit and cost will vary for different diagrammatic information sources and individual tasks.
This presentation model is investigated in this chapter for the domain of technical diagrams, such as electronic circuit diagrams or UML diagrams. Technical diagrams have a consistent and well-defined visual vocabulary. Depending on the diagram domain, layout and position may provide structure but is not part of the information content of the information source. Technical diagrams are therefore diagrammatic information sources as described in Chapter 2. Based on this, the assumption was made that communicating the spatial information in the diagrams would be of benefit to blind users. This was tested by a number of tools developed to present technical diagrams to blind people. The tools used a number of different user interface and information re-presentation approaches. The resulting diagram access tools were intended to both test the veracity or otherwise of the presentation model and to develop useful and practical re-presentation tools for the technical diagram types examined.
Section 3.1 outlines the basis for the TeDUB project that drove development of these diagram access tools and how it relates to this thesis. Section 3.2 describes the engineering approaches that can be employed. Section 3.3 describes the actual tools and evaluation of them by users. Section 3.4 draws conclusions on the success of the tools and the presentation of technical diagrams to blind people.
Chapter 5 combines the results of this chapter and the work on web accessibility described in Chapter 4 and draws conclusions on the re-presentation of visual content to blind people.
3.1. The TeDUB Project: Background
The Technical Drawings Understanding for the Blind project (TeDUB Project, 2004) was intended to allow blind people to read technical diagrams (Petrie et al., 2002). Technical diagrams can be obtained from many sources, for example scanned from print or obtained as bitmap images from the Internet. The TeDUB project was intended to take diagrams in electronic bitmap formats, perform image analysis to extract the diagram content, and re-present this content to a blind user. In practice working with bitmap images proved difficult and a way to import files from software engineering tools was developed. This chapter describes the development by the author of a set of tools intended to perform the re-presentation [9]: the image analysis is not relevant except where it affects the information available to re-present.
All user evaluations were performed and analysed by user groups in Ireland, the Netherlands, Germany and Italy under the supervision of the Centre for HCI Design [10]. Their results and conclusions are presented to inform the conclusions drawn by the thesis.
The TeDUB project focussed on three technical diagram domains. Two, electronic circuit diagrams and UML diagrams, are clearly diagrammatic information sources. The third diagram domain examined, floor-plan diagrams, is a pictorial information source, so the visual content of floor-plans is part of their information content. According to the framework presented in Chapter 2 this suggests that floor-plans are best presented to blind users through a direct tactile re-presentation using a tactile diagram. However, an attempt was made to use the tools developed for electronic circuits and UML diagrams because of a perceived demand for access to floor-plan diagrams and because it was an opportunity to try to extend the diagram presentation techniques developed for the diagrammatic information sources to examine whether they were still effective.
3.2. Potential presentation techniques
Without sight, there are two practical interfaces for communicating information: the sense of touch (haptic) and hearing (audio). Some systems employing these approaches have been described in Chapter 2 with reference to different models for the alternative presentation of visual information to blind people. This section provides a more detailed examination of the engineering practicalities of non-visual interfaces and how they might be employed to present visual content to blind people. Few of the systems given as examples rely exclusively on audio or haptic output: most combine them to some degree (e.g. Roth et al., 2001). They generally work in conjunction, reinforcing the output with a multimodal approach.
Throughout the following discussion it must be remembered that the majority of the information content of the diagrams of interest is communicated through text. This information is generally communicated to the user by a screen reader, a program that captures text information presented on the screen and outputs it to a Braille display line or through speech synthesis. It is up to an application to ensure that the text information that it presents is accessible to these screen-reader programs. This involves, for example, presenting text in standard operating system controls such as buttons rather than using inaccessible but novel controls that bypass the normal operating system drawing systems and generate their own text. Technologies such as Microsoft Active Accessibility (Sinclair, 2000) have provided application developers with the opportunity to help screen readers by crafting their applications specifically to support screen-reader interpretation. In the descriptions of different haptic and audio interfaces that follow, it should be noted that the user will be using a Braille display or speech synthesis to read the text content of the diagram in conjunction with or at the same time as the haptic or audio interface. These other interface features employed must therefore coexist with the fundamental screen-reader use. For example, in an interface using sound care must be taken that the information being conveyed does not conflict with speech output of any text currently being presented by the screen reader. The same general problem, in a more limited way because of greater user control over timing and activity, applies to input with a keyboard coexisting with a device using touch such as a Braille input mechanism or a joystick.
Instead of relying on a user’s screen reader, an application can be self-voicing: self-voicing applications are those that speak text aloud, without relying on a screen reader to capture text and present it to the user. This provides more flexibility for the developer, who has more control over speech output and can therefore employ different strategies such as spatialising speech around the user (employed for example in Crispien et al. 1994). However, there are significant disadvantages: the user must disable their own screen reader, or at least manage its conflicts with the application’s output [11]. This means that the user is cut off from their familiar screen reader, losing the ability to employ their established skills and strategies. The design of the diagram access tools for TeDUB therefore assumed the use of a screen reader and rejected the self-voicing approach.
The primary interface for the user with the tool will therefore be speech, augmented with other interfaces as necessary to communicate the spatial information in the diagrams. In text and speech communicating spatial information can only be done through description (e.g. “Left of this…”) which at best cumbersome and at worst useless when diagrams move beyond very trivial levels of complexity. The alternative is to employ an interface that itself has a spatial element. Excluding visual interfaces, this leaves haptic and audio presentation.
3.2.1. Haptic, tactile and kinaesthetic presentation
Devices that employ the sense of touch to communicate are often described as haptic. However, haptic has a more precise meaning, a combination of the kinaesthetic and tactile senses (Sekuler and Blake, 1994). The kinaesthetic sense is a sense pertaining to the position or movement of the body, the ability to know location and relative position. It is therefore explicitly spatial. A computer mouse uses this sense. The tactile sense pertains to what is felt by the skin and especially the hand, including fine shape and texture and hardness. Braille uses the tactile sense to allow readers to feel letters with their fingertips. Because both senses work so closely together they need not generally be regarded as individual senses, and so the term haptic properly describes their combined effect. While the literature commonly refers to any device that uses the sense of touch in some way, tactile or kinaesthetic, as haptic, this thesis will use this stricter definition.
Srinivasan and Basgodan (1997) describe the human sense of touch and its relationship with haptics. They also provide a further useful category, that of point-based haptic interaction. This is where the haptic device is limited to a single point in space, such as the end of a powered lever (e.g. a joystick). A movement in real space is mapped to an action in the computer system, for example moving a pointer or computer avatar. They are based on the perception of resistance to movement or forced movement of this single point. While surfaces of different textures and hardness can be modelled with accuracy, the limitation of the haptic interface to a single point makes it very difficult for users to use their hands and touch as they would with a real three-dimensional object. They would not benefit as much as they would from access to the real item that the haptic interface is representing. It is very difficult for users to discern tactile characteristics, including shape, since it does not support normal haptic exploratory procedures that people use when presented with a new object, described in Klatzky et al. (1987). These focus on texture and hardness, such as “this is smooth” or “this is soft”, and exploration of the object with the hands, discovering shape and dimensions with the fingers and palms acting in conjunction. Using a point-based haptic device is like trying to examine an object by holding one end of a pencil and moving the other over the object.
There exist specialised haptic devices with more capabilities, which are accurate and support three dimensions of movement. They are also all point-based. The leading high-resolution haptic device is the ‘PHANToM’ (Sensable Technologies, 2004), guidelines for use of which are provided in Sjöström (2001). This allows force-feedback output to the user and operates in three (rather than two) dimensions. Use of such a joystick might afford opportunities for creating esoteric user interfaces exploiting these additional abilities, but the guidelines note that even with high-powered devices like the PHANToM communicating spatial information is difficult. Sjöström notes that finding items in haptic space is very hard, external corners disrupt the development of a mental model of the shape, and reference points are vital for successful use: these are all consequences of using a point-based haptic device. Other haptic devices for blind people have been based on PHANToM devices, such as the TACTICS system described in Fritz et al. (1996) that used a PHANToM to present a tactile representation of mathematical diagrams. Schneider and Strothotte (2000) described a map navigation system using a combination of a PHANToM joystick and bricks that can be laid to indicate routes, but they provide no user evaluation of the results. Ramloll et al. (2000) described an attempt to communicate line graphs to blind people with a PHANToM joystick and an audio soundscape. A pilot study with three blind users found it difficult to track the lines because the lines were raised: lines depicted as grooves were more successful since the user could follow them with the joystick. Both the Schneider and Strothotte and the Ramloll et al. systems used the joystick to communicate the entire information source as though it were a real scaled tactile object in front of the user. However, these studies limited themselves to trying to describe very simple lines, rather than three-dimensional shapes. The haptic limitations of a point-based device are considerable, since they do not permit normal human haptic behaviour with the full hand. The failure of any real product or application for the joysticks outside of development implies that they are not suitable for communicating haptic information. They can do direction and even position but representing three- or two-dimensional shapes is too difficult.
Recent years have seen the appearance of cheap games joysticks with force-feedback functions that meet the requirements for basic haptic function described in Mark et al. (1995), with a high response rate maintained in hardware rather than the main control loop of the application. These types of devices are restricted to two-dimensional movement, so representations of data utilising a three-dimension approach will be impossible with the devices alone (for example, the room metaphor described in Savidis and Stephanidis (1995)). They combine a kinaesthetic sense (where the joystick is) with a tactile one (modelling a surface) so are 2D haptic devices. These are more limited than devices like the PHANToM but considerably cheaper. They share the limitation of being point-based and therefore difficult to use to model spatial information. Johansson and Linde (1998, 1999) tested one such joystick for use with blind people, modelling a 3D maze of walls through which users had to navigate, and found it to be effective as a two-dimensional tactile device. The limitations of these games joysticks arise from their small capacity for exerting force, which means they are unable accurately to model edges and surfaces. They are also less able to represent absolute position in a plane via kinaesthetics, since their relatively weak and inaccurate servomotors cannot accurately position the joystick against the exploratory movement of the user’s hand with the level of force and resolution required. However, they can represent relative positions (e.g. “Up and left”) with more success since this requires less of the device. If direction and position alone can be represented, and that with some degree of inaccuracy, then games joysticks can compete. The ‘DAHNI’ system (Morley et al., 1998a) used just such a games joystick and while it was not particularly popular with users it was acceptable. The ‘TGuide’ system described by Kurze (1998) required a specially-built point-based haptic device that moved in two dimensions in much the same fashion as a games joystick, but with more accuracy: however, a general solution must use a commercially-available solution. Games joysticks are suitable for examination in the TeDUB tools.
Tactile force-feedback mice have also been used to create haptic interfaces (mice without force-feedback are again kinaesthetic rather than haptic devices). These are also cheaper that specialised haptic devices. Gardner and Bulatov (2001) created a system that allowed vector graphic SVG diagrams (Ferraiolo et al., 2004) composed of lines and points to be navigated hierarchically using a force-feedback mouse. However, there is no commercially-available force-feedback mouse available on the market. The force-feedback mouse is generally of the same class as a force-feedback joystick.
A standard mouse is an effective input device for sighted people, but it is useless for blind people since it is a relative positioning device. It is used in conjunction with a pointer indicating the point of action on the screen, but that pointer is unavailable to blind people. Even if it were made available through an audio representation, the amount of positional information that needs to be communicated is prohibitive. While some researchers have attempted to communicate mouse-driven systems to blind users (for example Weber et al. 1996) and some support for the mouse pointer is built into most screen readers, it is reasonable to note that mice are not used by blind people in general and conclude that the obvious problems of knowing where one is pointing, where one can go to point at something else, and communicating what is under the pointer all combine to make standard mouse use impractical for blind users. It cannot even be used to indicate direction. A standard mouse is therefore useless for a TeDUB tool.
Attempts have been made to develop tactile panels consisting of many hundreds of pins and able to present a whole tactile surface dynamically such as Wellman et al. (1998). This poses considerable technical challenges (to make the interface work) and will pose considerable production challenges (making the resulting device affordable). Even if both of these problems are resolved it seems likely that these will have some of the problems of tactile diagrams produced without editing or careful production, in that the resulting surface will be too complicated to understand (e.g. reading areas of text, deciphering what elements are). This precludes automated transcription. Rotard and Ertl (2004) report some success in transforming and presenting bar diagrams.
One approach places a small panel of pins on top of a mouse which tracks its absolute position on the screen, so the device can indicate what lies under the mouse pointer (SeebyTouch, 2004; VirTouch, 2004). These have two problems: first, much like the point limitation of many haptic devices, only a tiny area is available for examination with the fingertips only. The user cannot use both hands to move over the diagram. Second, it is unlikely that users to be able to make sense of diagrams without extensive preparation (e.g. removing text, simplifying the image), and this precludes automated re-presentation. Wyatt et al. (2000) created a device using two refreshable Braille cells connected to a standard mouse. This still required preparation of the diagrams in electronic format to power the mouse output.
Finally, there are many other experimental and development tactile interfaces such as tactile gloves. MacKenzie (1995) provides details. However, these are all very much research projects, not contenders for use in the TeDUB project.
All of these systems require training and practice to be effective. This is demonstrated in Vitense et al. (2002), where sighted people were tested for their use of multimodal interfaces. A force-feedback mouse, sound and vision made a total of three modalities (haptic, audio and visual). Sighted people were tested using one, two or three of these modalities. Results indicated that unimodal feedback gave good performance and had a low perception of workload. Bimodal haptic and visual feedback came out best for the limited task tested. Trimodal feedback performed poorly in performance and perception of workload. Interestingly, however, an objective physiological workload score – pupil dilation – indicated that this trimodal system had the lowest workload, contradicting the users’ expressed beliefs about their performance. This suggests that greater training with trimodal systems may lead them to be of benefit. Conversely, it suggests that the haptic interfaces presented to users should be as simple as possible since they will be difficult for users to pick up and use effectively within the limited time periods available for evaluation.
3.2.2. Audio: directional and non-speech sounds
The second potential way to present spatial, positional and other visual information is audio. (The special role of speech has already been described, and since speech was left entirely to the user’s screen reader the following discussion does not apply to any speech output from the TeDUB tools). The factors involved in audio presentation are spatial – where a person perceives a sound as originating – and content – of what the sound consists.
Hearing is spatial. The general psycho-acoustical properties of hearing are described in Blauert (1983). Generally, humans are best at realising positional and informational information in the left-right axis, largely because of the position of human ears at each side of the head. Forward-back and up-down identification is more difficult. In addition, pitch (frequency) of sound is frequently perceived as height, so high-pitched noises are perceived as coming from a higher position. This is advantageous in attempts to overcome the problems in trying to communicate height – a system might use pitch instead – but disadvantageous if the system attempts to use pitch independently of height.
The ability of modern inexpensive sound cards to support 2D and 3D sound is demonstrated in the systems produced by Drullman and Bronkhorst (1999), which spatialised speech from different sources around the user simultaneously using standard computer components. For the purposes of this thesis, it is sufficient to note that cheap standard hardware can now support the location of multiple sounds from anywhere around the user. Any limitation is in the hardware used to generate these sounds: if the user has a surround-sound speaker system, featuring at least four speakers, then sound can be located externally all around the user. If the user is using headphones, which is far more likely in, say, an office environment, or two speakers on the desktop, they will generally only be able to discern sounds from along the left-right axis. Using headphones, they will locate sounds between the ears: using two speakers, sounds will be to left to right across the user’s front (Hawley et al. (1999)). Lorho et al. (2001) demonstrate that headphones are adequate for absolute sound localisation if the number of points is restricted to five, and three are easily discerned by almost all users.
The second factor in audio is content, what a sound is made up from. Sound has a temporal dimension, and thus sounds have duration. Sounds can either be fleeting and immediate – the tone that plays to announce a pop-up box, for example – or constant and contextual – the sound of a computer’s fan indicating that the power is on. The first attracts attention and provides information about the reason for the change of attention. It can be, and often should be, loud and disruptive (in that it is necessary that the user’s previous attention is distracted, rather than that the sound is unpleasant). These sounds will be referred to as immediate sounds. The DAHNI hypertext system (Morley et al., 1998b) for example successfully used nine immediate sounds for operations such as “go back” or to indicate headings. The second is continuous (although change in the context sounds is informative), and must therefore not dominate the user’s attention but inform and assist with the user’s current task. As already noted, it is especially important that it does not conflict with any synthesised speech. These will be referred to as context sounds. Together they make up a gamut of non-speech sounds.
An orthogonal dimension to these parameters is the extent to which they are real-world sounds. This leads to a classification of sounds into two classes (Gaver, 1986). The first class is auditory icons, real non-speech sounds such as the sound of paper being crumpled for the operation of the wastepaper bin in the common computer desktop metaphor. The idea behind these sounds is that just as images of common objects used in icons help inform their user as to their purpose, so sounds of common operations can perform the same function. The second class of sounds is earcons. These are sounds that do not correspond to any real-world analogue. They can be composed of simple notes or more complex chords and note sequences, called motives (sic) [12] (Blattner et al., 1989): the tone played in Microsoft Windows on displaying a popup window is a simple example, but they might also be short runs of notes or chords. This provides another discriminator, of course: the notes played (or the tune, in longer sections), assuming that the user can discriminate between and recognise the different combinations or tunes. Motives are constructed from some set of the fundamental parameters of a sound: pitch (frequency), timbre (the quality of the sound, for example “violin” versus “piano”), register (the timbre that is typical of a particular range, for example “soprano” or “bass”), and volume or intensity (amplitude). These combine with what sequence of notes is actually played to produce a huge potential set of earcons (James, 1997; Blattner et al. 1989; Brewster et al. 1993). There is some evidence that auditory icons are more effective than earcons for sighted people but are more likely to be annoying (Bussemakers and de Haan, 2000). Non-speech sounds can be formed of earcons or auditory icons. Their actual composition will depend on the structure of the information being augmented For example, context sounds in a hierarchy might build sounds up in length from the root of the hierarchy using all of pitch, sequence and timbre. The root node has a single note played on a piano. Its children are combinations of two notes (sequence) played on different instruments (timbre). Their children are all combinations of four notes (sequence) played on the same instrument as their parent (timbre) but in increasing pitch, and so on. By contrast, context sounds in a grid might use only two dimensions, such as pitch for position along one axis and duration for position along another: the further up the Y axis, the higher the pitch, and the further along the X axis the longer the sound. The AUDIOGRAPH system described in Alty and Rigas (1998) used this approach and was able to communicate shapes and positions. Immediate sounds might be used in either interface to provide feedback on errors or activities.
Because non-speech sounds can be used in addition to visual presentation, they have often been employed to provide additional information to sighted users using a primarily visual interface: the argument is that the gain from the additional bandwidth made available by using the audio and visual modality together is a greater than the cost of the extra cognitive load. This cost is kept to a minimum because the use of a different modality does not require the user to handle any interference between the visual and non-visual interface. However, they have been used to supplement wholly auditory speech-based interfaces (for output), such as Brewster (1998) who used context sounds to indicate position within a hierarchy, Kamel et al. (2001) who communicated spatial information in a diagram using 3D audio, Stevens et al. (1996) who attempted to convey gestalt information for mathematics through earcons, James (1997) who created a web browser that used earcons and auditory icons, and Ludwig et al. (1990) who provided spatialised audio access to a GUI window environment. These studies report success in attempting to use non-speech sounds to complement a text- or speech-based interface and support users performing navigation tasks. The TeDUB tools therefore employ non-speech sounds based on these approaches.
3.3. Tools developed and the findings
A number of different tools were developed, with increasing focus on the technical diagram domains, task requirements of users and the desire to evaluate re-presentation approaches. The intention of the work was to address the re-presentation of technical diagrams conforming to the description of technical diagrams in Chapter 2 as diagrammatic information sources. The presentation model was derived from the understanding of diagrammatic information sources as consisting of information spatialised in two dimensions but only to structure and define the content. Spatial information itself is not the content to be understood. The first tool developed used a simplified map of Europe to explore this presentation model. This was followed by two tools re-presenting two technical diagram domains, electronic circuits and UML diagrams. Finally, an attempt was made to apply the knowledge gained to a type of diagram that does not fit the model of a diagrammatic information source, floor-plans. This was intended to examine whether first, the findings on task analysis and its role in tool design could be extended to an information source in which spatial information is the content as well as the means to structure it, and second whether the tool developed had any practical benefit when applied to floor-plans irrespective of the theory behind it.
3.3.1. EuroNavigator 1
EuroNavigator 1 (Figure 10) was the first tool developed and implemented the model for diagrammatic information described in Chapter 2.
A map is defined in Chapter 2 as a pictorial information source: however, a simplified map of Europe was created for the sake of user evaluation since this allowed testing of the model and the user interface functions chosen to re-present it without requiring any knowledge of a technical diagram domain on the part of the users. Users were expected to know about the existence of countries, and the concept of a map, but beyond such basic knowledge no domain knowledge needed to be assumed. They also might find the content interesting. This simplified testing since it did not necessitate training users to understand the diagram type or finding already-knowledgeable users.
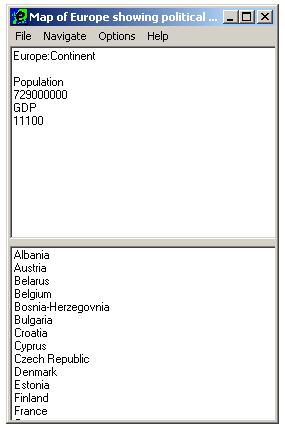
Figure 10: EuroNavigator 1 showing the top node in the hierarchy, “Europe”. Its child nodes, the countries in Europe, are shown in a list in the lower part of the interface.
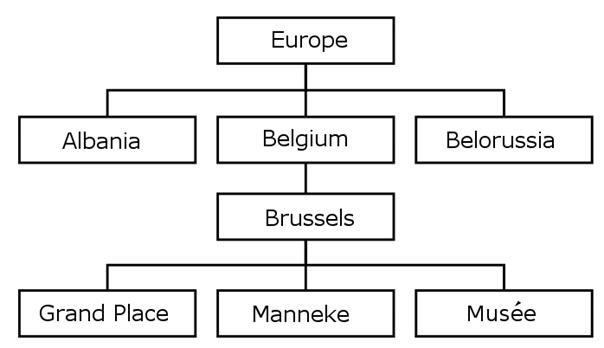
Figure 11: A section of the EuroNavigator 1 hierarchy.
A map is strongly hierarchical. The contents of the map were presented in a hierarchy of nodes, as depicted in Figure 10 and Figure 11. At any one time the user was viewing one of the nodes of the hierarchy. Information was accessed by navigating the hierarchical tree of nodes. Users could return to the top node of the hierarchy (a “Europe” node) at any time in case they became lost. The top panel of the user interface (Figure 1) showed the current node and any information associated with it in a simple text box, which could be explored and accessed easily by a screen reader. The bottom panel showed all the child nodes of the current node. Figure 10 shows EuroNavigator 1 displaying the current node (“Europe”) and its child nodes, the countries of Europe (“Albania”, “Austria”, “Belarus” et cetera). To assist users in orienting themselves in the hierarchy a “Where am I?” function displayed the user’s current node from the top node (e.g. “You are in Albania in Europe”) and a Summary function described the user’s position in the hierarchy (e.g. “You are at the Country level and there are 39 items under the parent Continent item”). Finally, users were able to choose whether they preferred the presentation of the hierarchy to be top-down (as in Figure 11) or left-right (as in Windows Explorer, with the top node to the left as in Figure 12). While the top-down orientation of a hierarchy is familiar to sighted people (e.g. organisation or genealogical charts) it was believed that blind people might be more familiar with the left-right hierarchy from Windows Explorer and other computer depictions of hierarchies. Evaluation would allow one orientation to be selected.
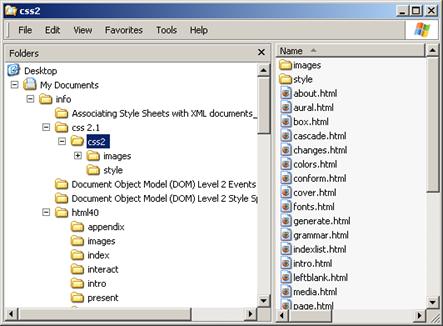
Figure 12: Microsoft Windows Explorer, showing the left-right hierarchy structure. The “css2” folder is the current node in the hierarchy.
An immediate sound, the standard Windows warning tone, was played when the user tried to move to a non-existent node in the hierarchy. Unique context sounds were used to identify every node in the hierarchy: the national anthem of the current country played constantly in the background while the user was in a country or its children. This was intended to orient the user within the hierarchy, providing constant feedback to the user of their location. In addition, the context sound was spatialised around the user to provide some indication of position in the layout of the diagram. This use of spatialised sound was the only provider of spatial information in the EuroNavigator 1 tool.
Evaluation Results of EuroNavigator 1
EuroNavigator 1 was evaluated by TeDUB project partners. Their results are summarised here: full details can be found in the project document “D1.1 User Requirements Document (Version 1) TeDUB-D11-URD-CU.”
The application was evaluated with 29 blind users, of whom three had some limited sight and used magnifying technology. The tool was presented to the user with a manual, training was given and the users had time to familiarise themselves with the tool. Users were then asked to perform some simple information-finding tasks, such as “What is the population of Albania?” Users’ comments and activities were recorded by the experimenters. This evaluation was informal and was intended to gain some understanding of whether the implementation of the diagrammatic model as a hierarchy of nodes was successful and how the non-speech sounds were received. The summary of the user evaluation contained the following statements:
· “Ps explained that they tend to conceptualise hierarchies in terms of a horizontal tree structure moving from left to right, instead of the traditional top-down conceptualisation because they already use file/directory structures in programs such as Windows Explorer.” (p47)
· “Ps requested that the Euronavigator use the same keyboard commands for navigating around hierarchical structures that they currently use to move around Windows Explorer.” (p47)
· “Some additional keys were also suggested such as HOME; END; BACKSPACE and shortcut keys to jump through lists.” (p47)
One user group (the Netherlands, 20 users) reported:
· “All the respondents used the arrow keys, the enter, tab and escape keys and the Function key in combination with the dot key to listen to the descriptions. However, we noted that the respondents seemed to use a very effective trial-and-error technique to navigate, rather than perhaps fully understanding the ordering of the hierarchy and the meaning of the function keys.” (p37)
· “While trying to find the answers to the questions, most of the participants went back to Europe to start the search from the beginning.” (p37)
· “Participants did not lose themselves within the hierarchy, and did not have to use the ‘Where Am I?’ function key. When participants did get lost, they simply returned to the top level using the ‘Home’ key.” (p38)
3.3.2. EuroNavigator 2
The hierarchical representation of diagram information evaluated by EuroNavigator 1 provided the user with a mechanism to access all the information in the diagram. However, it did not attempt to convey the connections between nodes in the diagram (countries in the European map with a common border), and neither did it communicate the spatial information in the diagram. The connection information is vital to reading any technical diagram, so must be communicated. As discussed in Chapter 2, it is reasonable to assume that the spatial information is of importance to the user in understanding and using visually-presented technical diagrams, and that this information should be re-presented to blind users in an accessible form.
The next TeDUB tool was therefore an extension of EuroNavigator 1 that attempted to communicate connectivity and spatial layout. The limited spatial information provided through the context sounds in EuroNavigator 1 was extended by more audio and joystick functions, and also implied through the communication of the connectivity information through the spatialised joystick interface. Figure 13 shows the simple screen-reader-independent interface.
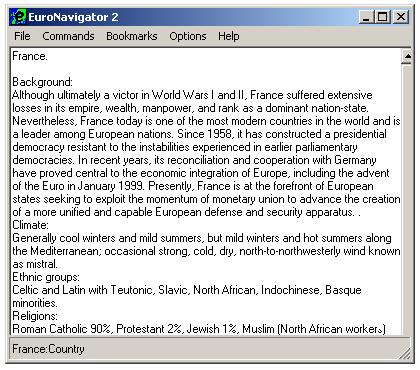
Figure 13: The EuroNavigator 2 interface.
A European map was used again. No attempt was made to represent the shapes of countries (a pictorial concept). Instead, a graph of nodes was used where each country was a node. The node for the country was located at the position of the capital city. Connections between country nodes indicated common borders (or close proximity in the case of France and the United Kingdom). Information about the country was contained in the country node. The EuroNavigator map was again created by hand. A section of the map is shown in Figure 14, and the corresponding graph of nodes modelled in the tool in Figure 15.
Figure 14: A section of the map of Europe used in the EuroNavigator 2 system. The red points indicate the national capitals.
Figure 15: The European map as a graph of connected nodes depicting the countries from Figure 14. Their location is determined by the capital city location.
The Europe map also contained a four-level hierarchy: Continent, Country, Country contents (two types of node, Capital City and National Artists), and National Artists (children of the National Artists node), a total of 136 nodes. A section is shown in Figure 16.
Figure 16: A section of the European map as a hierarchy of nodes. Only the Country-level nodes (e.g. Finland, France) appear in the graph of nodes shown in Figure 15.
Spatial navigation represented the diagram as a graph of connected nodes. The nodes were the same as those represented in the hierarchical representation, but their connectivity was completely different and only the country nodes were included. For example, the top-level Continent node operates as a structuring node that contains summary information and a consistent place to return to in the hierarchy, not an identifiable item in the original diagram. It therefore cannot be accessed through this navigation view. Spatial navigation was performed through commercial games joysticks, such as the Saitek Cyborg 3D or Microsoft Sidewinder joystick, which served as inexpensive haptic devices (Saitek 2004, Microsoft 2004a). The joysticks were accessed through the Microsoft DirectX 8 API, so any compliant games joystick should work (Microsoft 2004b). However, because the arrangement of keys on a joystick can vary from model to model, the tool was built for the Microsoft joystick (later tools used the Saitek version).
Spatial navigation utilises a simple haptic device with limited force-feedback ability. This was employed in a ‘Passive Joystick’ function as follows. At any time, the user could use the joystick to indicate a direction from the current node. If a connected node lies in the direction indicated from the current node, the system displayed the name of the node and played the spatialised context sound in the direction of the node (using Microsoft DirectX and whatever 2D or 3D sound capabilities were available). The spatialised sound gave direction and distance (through volume). If the user centred the joystick the current location was indicated. Figure 17 demonstrates how the joystick function operated when the current node was the Spain node. Up and to the right the user would find a connection to the France node, and to the left the user would find a connection to the Portugal node.
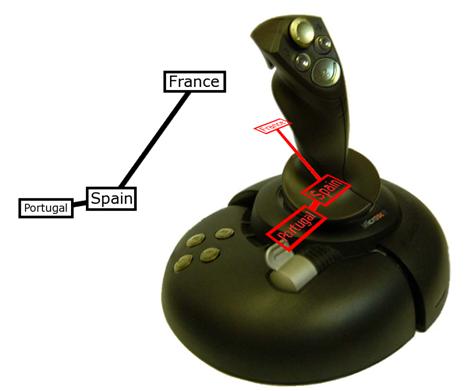
Figure 17: The Passive Joystick function conveying connectivity and spatial information.
Pulling the joystick trigger moves the user from the current node to the node indicated by the joystick direction. This becomes the current node. In this way the user could traverse the diagram. In a diagram that is also a complete graph (a user can travel between any two nodes by some route) the user can explore the whole diagram. The European map at the country level is just such a graph: a user could travel Ireland – UK – France – Belgium – Germany – France – Spain – Portugal and so on.
An alternative function employed the force-feedback functions of the joystick, shown in action in Figure 18. Using the ‘Active Joystick’ function the user could trigger the display of a list of connected nodes, and the selection of a neighbour triggered the operation of the joystick to point in the direction of the connected node. For example, a user in the France node could bring up the list of connected nodes, and move the list selection (with cursor keys or the hat joystick on top of the main joystick) to indicate the UK. The joystick would then move up and to the left in the user’s hand, the direction of the UK node from the France node, so the user can feel the direction being indicated. In effect, this operated in the reverse way to the standard spatial navigation function.
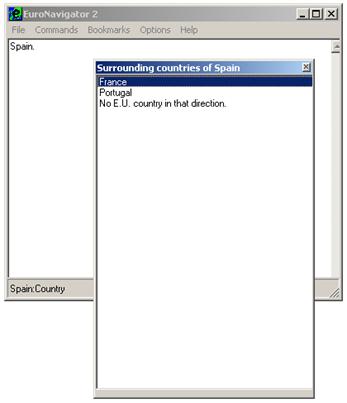
Figure 18: The Active joystick function in action. The current node is Spain, and the user has selected the France neighbouring node. The joystick would thus push the user in the direction of France from Spain (up and right).
Finally, the user could forego joystick and use text-based lists to navigate from node to node through the connected graph. This ensured that users were able to access all the information content of the diagram, the connections between nodes as well as their content, without recourse to a spatialised user interface function.
This prototype again used context sounds to convey position in the hierarchy. The context sounds were short simple two-second snippets of music, with one melody line and no harmonies or chords. This was intended to keep the context sounds as simple and unobtrusive as possible while remaining individually identifiable. Each country had a different snippet, and children of the country node played the same melody but with a different timbre. This was intended to provide information on the structure of the hierarchy and the user’s current position within it. The context sounds were played when the user moved to a node, or used the joystick to indicate a particular direction.
Two spatialised audio functions were provided. An audio Location function used 3D sound to play an identifying sound spatialised to reflect the position of the current node relative to the centre of the diagram. This function could either be spatialised as though the user were in the centre of the diagram (so the sound could come from anywhere around the user) or as though the user were at the bottom edge of the diagram (so the sound came always from somewhere in front). The latter was intended to capitalise on the better resolution of sounds to the front of a human and the likelihood that most evaluations would involve 2D rather than full 3D sound (i.e. most evaluations would use stereo speakers or headphones). A Radar Sweep function attempted to indicate the direction of connected nodes solely through 3D sound. A tone was played that moved around the user, starting straight ahead as north/up on the diagram. When it reached a direction in which there was a connected node, the tone changed to indicate a neighbour and the name of the neighbour was provided.
Acting on the findings of EuroNavigator 1, a number of functions were provided to support familiar Windows functions for navigation and information foraging for finding information in the diagram. Bookmarks were provided to allow the user to return rapidly to nodes that had been previously visited and determined to be of interest without having to perform any distracting navigation operations. It was envisaged that this would be used to allow users to move rapidly between previously-explored nodes, for example in comparing two countries or composers, or returning to an area noted to be of interest in a previous exploration activity. Any node in the diagram could be bookmarked. It could then be made the current node with a keyboard shortcut. Search was designed for circumstances where the diagram was very large and the user was unlikely to use the diagram enough to gain any appreciable survey knowledge of the entire diagram. Instead, the user may want to move directly to and between, and find, items of interest that have not been bookmarked. With the relatively slow flow of information from a diagram for a screen-reader user (as opposed to a print user of the original diagram) this may support more suitable search and use strategies. Search was designed to operate in a similar fashion to the find function in Microsoft Windows Notepad, since this was judged to be likely to be familiar to blind users. A Back function analogous to that of a web browser allowed the user to retrace previous nodes visited. This traceable route was maintained across different representations of the diagram. Whether the user moves from node A to node B via hierarchical navigation, spatial navigation, the search function or any other method, the back function always retraces the node-by-node route taken. This consistency is intended to provide the user with the assurance that they can always return to their previous node. Users should therefore be more comfortable with exploring and navigating, since they know they can always go back if the next node is not suitable (a finding from web navigation and information foraging, e.g. Nielsen 1996).
Evaluation of EuroNavigator 2
EuroNavigator 2 was evaluated by TeDUB project partners. Their results are summarised here: full details can be found in the project document “D5.2 Evaluation of the Pre-prototype TeDUB-D52-CU-TZI.”
Evaluation for EuroNavigator 2 involved 24 blind users. The following is taken from the executive summary:
· “All Ps found the EuroNavigator 2.0 easy to learn and easy to use and for those Ps who had taken part in the previous Wizard of Oz study, they commented that the latest system was a marked improvement.” (p8)
The following are taken from the summary of results:
· “In general, Ps found the pre-prototype easy to learn and use particularly because the functionality was comparable to that of Windows Explorer. Indeed, Ps found the cursor keys a simple way to navigate through the hierarchy and were able to find information quickly and efficiently.” (p51)
· “Ps found the other various keyboard commands very useful. For example, the Search function was rated to be very useful by Ps, giving a mean rating of 4.17 and was chosen on a frequent basis by Ps to find information.” (p51)
· “All of the Ps thought that the error sounds were useful… The dead-end sound was liked because it was unobtrusive and is better than repeating the last list item which can sometimes make users think that the system is unstable… In contrast, the context sounds were not rated as being useful with Ps giving a mean rating of 2.06. Across all countries, the Ps asked for the context sounds to be turned off fairly soon after beginning the study. Ps found these sounds to be irritating and obtrusive, often making it difficult for them to hear and concentrate on the speech output… It would seem that the information given by the context sounds was not that valuable and certainly did not warrant the intrusion that the context sounds gave.” (p52)
· “There was a mixed response regarding the 3D surround sound capability.” (p53)
· “Overall, Ps found the joystick easy to use for navigating around the system, giving a mean rating of 4.13 … Many Ps liked the joystick because it gave them a spatialisation aspect, which they did not achieve with the keyboard, in particular, the free sweep option on the joystick provided them with a fairly good spatial layout of the countries (mean rating = 3.95) … Ps found the active joystick a novel experience and it provided them fairly well [sic] with some spatial layout of the countries (mean rating = 3.38).” (p53)
· “Ps were asked if they had a preference for either the keyboard or joystick or whether they found the two input devices to be equal. Interestingly, there was a 3-way split across all Ps. That is, 33% of Ps preferred the keyboard, 33% preferred the joystick and 33% rated them as equal in terms of their preference.” (p53)
3.3.3. DiagramNavigator 2: Digital electronic circuits
The next step in the TeDUB project was the development of a tool, DiagramNavigator 2, dedicated to one of the real TeDUB diagram domains. Digital electronic circuits were the first to be attempted (Blenkhorn et al., 2003). The circuit diagram used for evaluation, shown in Figure 19, was produced by image analysis of a raster bitmap source: because of the limitations of this process it lacked any text labels (on the diagram or individual components) However, it did suffice for the full import of this diagram.
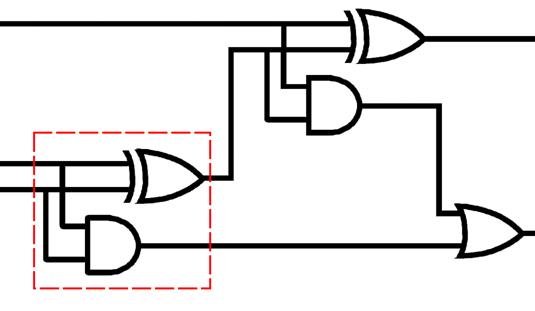
Figure 19: A digital electronic circuit diagram, a full-adder. The highlighted box is a half-adder. Two half-adders plus an OR gate (bottom-right) make up the full-adder. Each half-adder is composed of an XOR gate (above) and an AND gate (below).
At a fundamental level electronic diagrams such as these contain components, such as AND gates, represented by graphical icons, joined together by lines to form connected graphs, in which each component is a node. The connected graph re-presentation of this content is obviously appropriate. It is less obvious however that the hierarchical re-presentation is relevant as it was in the European map. However, in electronic circuit diagrams the individual components (e.g. AND, OR, XOR) when combined form higher-level aggregation components (or alternatively higher-level components are composed of lower-level components). In Figure 19 the diagram as a whole represents a full-adder electronic function. However, this high-level function is achieved by the combined action of the five individual components which when connected as shown have the property of performing this full-adder function. The five actual components in turn compose two “half-adder” components, each of an AND gate and an XOR gate, plus one extra individual component, an OR gate. The diagram was therefore re-presented as a three-level hierarchy: full-adder level, half-adder level, and atomic component level, as shown in Figure 20. EuroNavigator 2 contained aggregation and compositional relationships encoded in the same way, in the hierarchy: information about a country (city, composers) was located in child nodes of the country. The hierarchical re-presentation is still relevant for this diagram type.
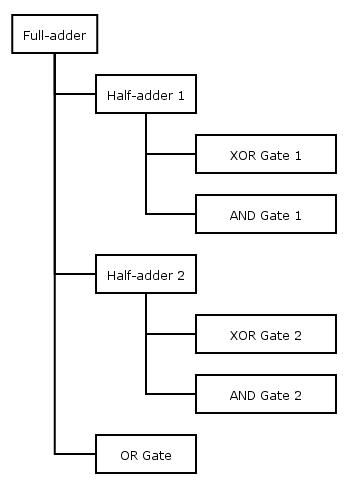
Figure 20: The hierarchy of the digital electronic circuit shown in Figure 19.
This tool made a greater effort to unify the spatial navigation system with the hierarchical navigation. The Active joystick function was dropped in favour of the Passive joystick function. The Passive joystick function was identified as more popular with users and as better able to be integrated into the tool as part of a single user interface since it left the user in charge of the haptic device rather than having it drive the user and take attention away from the main interface.
The DiagramNavigator 1 studies suggested that direction between nodes should be consistent from one node to another. However, this brings up a complication that did not arise in the European maps but which began to become apparent in the DiagramNavigator 1 studies. Because of a diagrams’ layout multiple connections could exist in the same direction from the current node, which would not permit joystick or audio direction to differentiate between them. Figure 21 illustrates this problem.
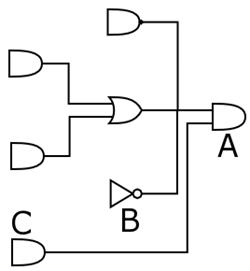
Figure 21: A diagram showing connected nodes in line: A is connected to B and C, but they lie in the same direction from A so cannot be discriminated by a simple pointer like the joystick.
There are two potential causes of this. Firstly, two nodes may be close together from the point of view of the current node, so they appear to be in the same direction. This is unlikely given the high resolution of the direction pointing (360 possible directions). The problem would lie more in the ability of the user to differentiate between three (or more) nodes separated by one degree of direction with a simple games joystick: Generally, directions are artificially expanded, so a node in a direction indicated by 37 degrees of rotation right from north would be indicated to the user by the system for any value from 32 to 42 degrees. Where nodes are close together, this wider sweep must be reduced to show the additional nodes. Where they are very close, it may be impossible for the user to identify the different nodes in this method. This situation may be unlikely in smaller diagrams, but more a problem in larger ones: in amelioration, the requirement of sighted users that objects be fairly evenly spaced so lines can be differentiated may prevent diagram designs that rely on such fine distinctions of space. The second potential cause of this problem is the existence of two connections between the same two nodes. The option to represent this as two connections differing slightly in direction was rejected, based on the findings from DiagramNavigator 1, since this approach appeared to damage the user’s ability to build any spatially-accurate mental model of the diagram layout (since direction indicated by the joystick would not correspond to the real direction in the diagram). One solution might be to combine information about the multiple relationships when presenting the connection to the user. This would have to be diagram-domain-specific and alert the user to the need for further investigation while accurately communicating the true nature of the relationship. In fact, with the level of discrimination possible with the joystick (though less practical) the problem did not arise with any of the diagrams used.
The spatial information was obtained from the diagram source, rather than created afresh for the user. This preserved the positional information in the original diagram, which may be useful if the blind user is referring to the same diagram as a sighted user or using a diagram from a textbook, when diagram contents may be referred to by position (e.g. “the Class in the top-left-hand corner”). It also guaranteed that the spatial information is consistent each time the diagram is accessed.
Figure 22: The Map function showing how the position of elements on the diagram is mapped to the position of the joystick.
A new function was developed to allow the user to form an idea of the whole diagram layout using the joystick, illustrated in Figure 22. This Map function related the absolute position of the joystick within its field of movement to the corresponding node, if any, at that position in the diagram. A node was indicated through the display of the name and a spatialised sound. The user could click the trigger button while a node was indicated to make that node the current node. The intention of this function was to allow the user to obtain a quick overview of the spatial layout of the diagram and its contents. Only nodes with a spatial location were accessible through this function. A rectangular graph would be distorted when it was mapped to the square joystick field.
The Back function was complemented by a Forward function, allowing users to return to nodes left by the use of the Back function. This is in line with web browser behaviour and is part of the move to standard and familiar interface components suggested by the previous user trials. Any node in the diagram could be annotated. This was a plain-text addition to the node that could be edited by the user. The Search function was extended to search Annotation. This was intended to allow the user to customise the diagram content and support their navigation and work tasks. DiagramNavigator 2 allowed bookmarks and annotation to persist between sessions (they are obviously diagram- rather than application-specific): if they are to be of use, their persistence is crucial. In comparison with EuroNavigator, DiagramNavigator is addressing real and variable diagrams, and one use for documents is as external memory stores or archives. This necessitates some way to retain information added by the user.
Finally, a new function similar to the Passive joystick function allowed users to gauge how far other nodes were irrespective of connectivity by allowing them to assign a distance and show nodes only within that radius. This Locale function was hoped to provide information on spatial information and particularly meaningful grouping of nodes, such as in sub circuits.
Evaluation of DiagramNavigator 2 – Electronic Circuits
DiagramNavigator 2 was evaluated by TeDUB project partners and 26 users. Their results are summarised here: full details can be found in the project document “D5.3 Report on evaluation of 1st Prototype TEDUB-D53-EFP-CU,” 3 October 2003.
· Users were able to access the diagram contents and perform tasks related to the domain, such as identifying the output from a digital circuit when given the inputs. However, they appeared to find this task difficult to perform.
3.3.4. The TeDUB System 1: UML Diagrams
UML Diagrams were the next technical diagram domain to be addressed in the TeDUB project (King et al. 2004). UML Diagrams are software engineering diagrams used in software development. This is a field where blind and vision-impaired people have been able to participate in the employment market and in education. Computer code has historically been text, and therefore accessible to blind people using assistive technology (in the form of screen readers). In recent years the growth of software engineering has led to an increase in the use of modelling tools that use rich visual presentation to facilitate software development by sighted programmers. These tools are visual languages that aid in the design of software systems. One of these languages is the Unified Modeling Language (UML) (OMG, 2004a), a graphical modelling standard. It reflects the dominant object-oriented programming paradigm, and is increasingly used in commercial software development and higher education. Baillie et al. (2003) discuss how blind people can use UML and conclude that an audio-haptic approach like the TeDUB system would be best.
UML diagrams consist of nodes and connections between them. This general model allows for twelve types of diagram, though for the purposes of the TeDUB project four types of diagram were identified on the basis of experience and the examination of textbooks on UML to be more commonly used. These are Class diagrams (Figure 23), Use Case diagrams (Figure 24), State Chart diagrams (Figure 25) and Sequence diagrams (Figure 26).
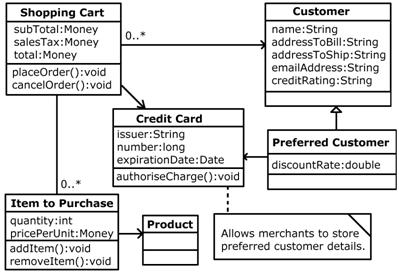
Figure 23: A UML Class diagram. From OMG (2004b). The graph model is obvious: Classes (rectangles) are connected by different relationships. The Note node (“Allows merchants…”) is represented as an Annotation to the Credit Card node.

Figure 24: A UML Use Case diagram. From OMG (2000b). The graph model is clear: this one depicts Actors (stick figures) and Use Cases (ovals) and the connections between them.

Figure 25: A UML State Chart diagram. From OMG (2004b). There is a top-level graph (start, empty, partially filled out, filled out) but the partially filled out node also contains two other graphs.
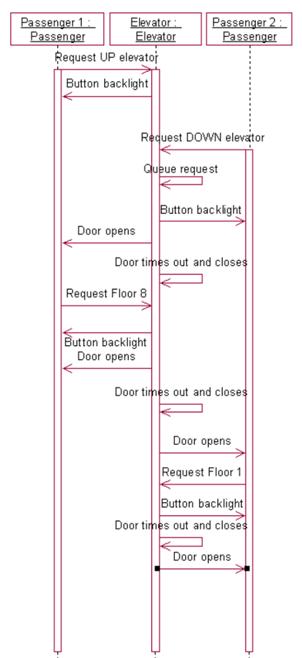
Figure 26: A UML Sequence diagram. From OMG (2004b). In strict UML terms there are three nodes: Passengers 1 and 2 and Elevator. The TeDUB System represents each message point as a node (e.g. “Request up elevator” sent at Passenger 1 time 0; “Request up elevator” received at Elevator time 0; and Nothing Happening at Passenger 2 time 0.
Since this is a different diagram domain from DiagramNavigator 2 different design decisions were required. Digital circuit diagrams such as the full-adder contain very simple nodes with very little content, such as “AND Gate 3”. The information in the diagram rests in how the components are connected together in the graph. This structure was reflected in the task that caused users so many problems, finding the outputs of the circuit: this required the user exhaustively to explore and analyse the connections between nodes. In contrast, the information in UML diagrams is located within node content as much as in the connections between nodes, as examination of the diagrams above will attest. Tasks will involve more information-foraging (e.g. “What are the operations of this class that I must implement?”) and are more likely to be limited to single connections. For example, a UML user might ask “What classes inherit from this one?” requiring only the examination of the nodes directly connecting to the current node, where an electronic circuit user might ask “What is the value of the input for this AND gate?”, requiring the value of every component in the graph of nodes connected to the inputs of the AND gate to be calculated no matter how distant. Both these diagram domains are diagrammatic information types, and both will have some of the kind of large-scale connectivity problems that proved very difficult in DiagramNavigator 2, but UML diagrams will generally be easier to handle for blind users.
The TeDUB project was intended to allow the use of image analysis of raster bitmap graphics to produce diagram content which would then be presented to a blind user. However, this proved to be very difficult to accomplish, which imposed limits on the diagram content available to be communicated to the user. This led to the adoption of an alternative route for the acquisition of diagram content: the transformation of data files from UML design applications. UML diagrams are used by software engineers to specify and design systems, and can be used for automated code-creation. The engineer can create a UML diagram in a UML design application and use this to generate code. Applications such as IBM’s “Rational Rose” or Gentleware’s “Poseidon UML” generate Java code (IBM 2004; Gentleware 2004), and both these tools support the OMG’s open XML Metadata Interchange (XMI) standard for representing UML in XML (OMG 2004c). It is possible, therefore, to export diagrams in this format from these UML applications. These can then be converted by an automated XML process into the format supported by the TeDUB tools with no loss of information: all the information in the original diagram is perfectly available. By comparison, image analysis of anything other than the simplest raster bitmaps drawn to an unrealistic set of requirements (e.g. drawing components in a different specified colour from connections) is inaccurate and slow. The next TeDUB tool was called the TeDUB System (Figure 27) and handled UML diagrams obtained from UML design applications which were full information equivalents of the real UML diagrams.
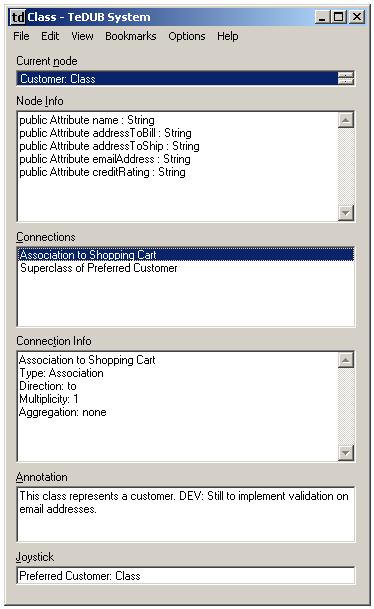
Figure 27: The user interface of the diagram reader showing the diagram depicted in Figure 23. The Joystick field displays any neighbouring connection indicated by the joystick direction.
In light of the findings from the DiagramNavigator 2, task analysis was employed in the design of the TeDUB System. Most tasks were assumed to be accomplished simply by the presentation of the UML content in an accessible form and in a consistent model. This might appear to run counter to the expressed need for dedicated functions: however, since the different characteristics of this domain compared to electronic circuits suggest that the main tasks would again be information-foraging, as in EuroNavigator 2, and information-foraging is well-supported in the tools through familiar, hierarchical and text-based function (e.g. Search, Annotation, Bookmarks, Windows-Explorer-style navigation) then this assumption is justified. There was therefore no direct identification of any task like the calculation of outputs from inputs in the electronic circuits. Some well-defined and obvious tasks were identified and support for these tasks was addressed in the structuring of the diagram re-presentation. For example, the identification of Actors in Use Case diagrams, identified as a likely task, was supported by ordering the Use Case diagrams so that all Actors nodes were collected together.
As with previous tools, the hierarchy structure generally complied with simple alphabetical order, and levels did not wrap but had defined and fixed start and end nodes. There are two reasons for this: it is simple and predictable, and it allows users to skip through items in a hierarchy level by pressing a letter key – the nodes beginning with that letter are cycled through. This is common functionality with Windows lists and was requested by users from EuroNavigator 1 onwards. However, an exception to this rule was created for UML State Chart diagrams. There is often a definite order in which state charts should be traversed, with one node indicating a start node and another node indicating an end node. Figure 25 shows these as a black disc and a black disc with a circle round it respectively. Beyond these definite start and end points it is not necessarily possible to identify a linear progression through the possible state nodes. State nodes are therefore presented in the usual alphabetical order except for start and end nodes, which are placed always at the start and end of a hierarchical level. This is intended to support the user task of following the sequence of states in a State Chart diagram to identify the changes over time: the intention is that the user can move quickly and easily through the hierarchy to the start or end node, then navigate through the connected graph to identify the sequence or sequences of nodes that can be followed.
UML Class and Use Case diagrams comply with the general graph model of nodes and connections very well. However, there is one complication, in that the connections between nodes can hold a great deal of information: in some diagrams that connection between two nodes becomes a node in its own right. With so much information contained in the connection, there are two possible representations: to present the connection itself as a node, or to include the information contained in the node in duplicate at each end of the connection. To evaluate the two possibilities the option was provided in this tool to allow users to switch between the two representations. Otherwise, Class and Use Case diagrams require only a single connected graph to represent them.
The graph model had problems with UML Sequence diagrams, as depicted in Figure 26. This diagram type shows the interaction over time between objects through the exchange of messages. The objects are portrayed in columns, the messages as arrows between them. Uniquely in UML diagrams there is a spatial element to the information that is not simply presentational, to the extent that the order of messages down the page indicates the order of their occurrence. If this were presented to the user in the standard node model, each object would be a node and all the messages between them would be connections, not distinguishable by anything other than iteration through a list. This is not a good representation of the diagram for supporting exploration and examination of the diagram content, since it would not define the order of messages. The tool therefore rearranged the diagram, creating new nodes that corresponded not to the objects but to the points in time when messages are exchanged between the objects. This is illustrated in Figure 28, which shows all the nodes that resulted from rearranging the UML Sequence diagram in Figure 26. The user could then move easily between the nodes using spatial navigation and gain an understanding of the sequence and connectivity information. This is intended to support the user task of obtaining an understanding of the temporal information in the diagram and the message flows, a key aim of this diagram type.
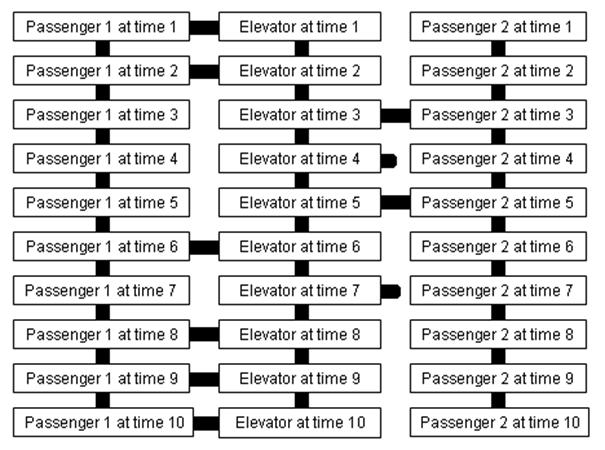
Figure 28: The spatial layout of the UML Sequence diagram
Finally, UML State Chart diagrams cannot necessarily be represented as a single connected graph and hierarchy level because it contains nested sub-graphs. The UML State Chart diagram from Figure 25, showing several nested sub-diagrams, is presented in its hierarchical representation in Figure 29. Each level will be represented as a graph as well. This means that State Chart diagrams are more complex that Class or Use Case diagrams.
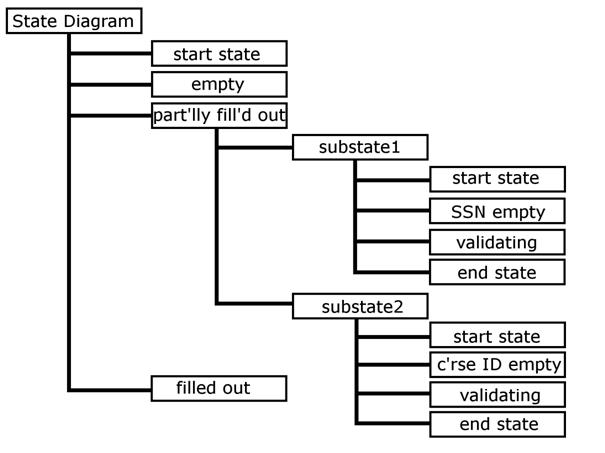
Figure 29: The State Chart diagram from Figure 25 and its hierarchical representation. Each level will have a spatial graph representation, so the whole diagram is represented by one hierarchy and three graphs.
A new Text View function was added. This was a representation of the diagram content as a linear text passage. Figure 30 shows the Text View for the UML Class diagram of Figure 23. All the node content (but not the connections) of the hierarchy was presented flattened into a continuous body of text and the user had a caret to explore and examine it with their screen-reader. Normal text navigation shortcuts were available (e.g. Control + Right cursor for skip a word). This was intended to provide a completely accessible and straightforward representation of the diagram content. A Find function allowed users to search the text display for content of interest to support its use as an alternative presentation. The Text View was linked to the main interface so the current node was reflected in both and the user could move back and forth without changing location.
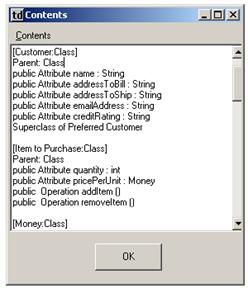
Figure 30: The text view in action
A Compass navigation function made it possible to move from node to node by using the number pad keys centred on the five key. This is shown in Figure 31. In this example, pressing the number six key made the system check for a node to the right (or east of) the current node on the layout of the diagram. If a connected node was identified in that direction, the user moved to it just as if they had indicated that direction with the joystick and clicked the trigger. If no node was available an immediate sound was played. For the UML diagram in Figure 31, with “Credit Card” as the current node, the user could move to “Shopping Cart” (north-west, or above and to the left of the current node) with the seven key, and to “Preferred Customer” (east, or to the right of the current node) with the six key.

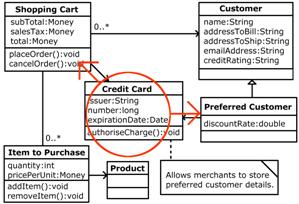
Figure 31: The compass navigation function in operation
This navigation function was based on the commonly-used rooms metaphor encountered in text-based adventure games, where the user is located in a particular location (node) and accesses neighbouring connected rooms through cardinal compass directions indicated by text entry (e.g. “NW”). The function was developed both to support users who did not have a joystick but could still benefit from a form of spatial navigation of the diagram graph and to try to overcome the persistent problems with the joystick functions experienced by some users by providing a simpler alternative. However, the function can quickly become unusable as the number and more importantly connectivity of the nodes in the diagram increases. The joystick functions face the same problem but to a lesser degree because they have greater discrimination of direction. The Compass function is more problematic. First, a maximum of eight connected nodes can be resolved, so for any node with more than eight connected nodes it is impossible to represent every connection with this function. Second, diagrams are not laid out to maximise the success of this function, and the original diagram layout is preserved in importation of the original diagram source, so even with fewer connections and nodes it is likely that some of the connections in the diagram will be missing with this function. There is no simple solution to this problem. One solution would be to rearrange the nodes in the diagram so that they do connect only in the eight cardinal compass directions: however, this is impossible where any node has nine or more connections, and would break the consistent spatial representation of the diagram (going north from A to B, for example, would not guarantee that going south from B leads to A). The best solution might be to tell the user that several nodes lie in the direction indicated, and have the user choose between them: this might be cumbersome. In practice this problem did not arise for any of the diagrams tested.
The tool could be instructed to display only nodes of a particular type, or hide nodes of a particular type. This can assist in removing extraneous detail from the diagram for the current task. For example, Class diagrams generated by UML applications often contain Package nodes representing programming libraries. Using the Class diagram does not require examining these common nodes, since they do not change from diagram to diagram. Hiding the Package nodes therefore reduces the apparent complexity and content of the diagram without losing any important information and improves information foraging. Hidden nodes were removed from view in the hierarchy navigation view. They did not appear as the results of Search and could not be accessed by movement in the hierarchy view. The system operated as though they did not exist. If the user chose to hide the node type of the current node, their current node was not changed lest it confuse the user. Instead, the user was able to move away from the node but not return to it. However, hidden nodes always appeared in the spatial view to maintain a consistent spatial representation of the diagram for the user.
Results of evaluation of the UML Diagram tool
The UML Diagram tool was evaluated by TeDUB project partners and 34 blind users. Their results are summarised here: full details can be found in the project document “D5.4 Report on evaluation of the second TeDUB prototype on UML diagrams in Italy, Ireland, the Netherlands and the United Kingdom.”
The following are taken from the Conclusions of the document:
· “Most of the users expressed a very positive response to the system and felt it would be a significant aid to their work/studies when using UML and other modeling methodologies such as Entity diagrams. A harrowing example is given by one of the British participants: this software engineer had been made redundant when her department switched to UML for she was unable to visualize the diagrams.” (p60)
· “Key positive points where [sic] the simple operation of the interface when using the keyboard commands; the combination of keyboard and joystick functions facilitate a spatial representation. Together with additional functionalities like the text view the system is sufficiently equipped to give access to these kind of UML diagrams. The system is quite easy to learn due to its simplicity.” (p60)
· “The fact that the same information can be get out of the system in different ways is a strong point. Users of the system have their own strategies and preferences to navigate the information and to interact with the system.” (p60)
From the discussion of various user interface functions:
· “The text view is a relatively new feature to the TeDUB System. On base of the reaction of the participants this option to get an overview of the diagram in a linear way seems very useful.” (p58)
· On representing connections between items as nodes in their own right: “Most of the participants did not use this option and did not think it will help them.” (p58)
3.3.5. The TeDUB System 2: Floor-plans
Floor-plans are two-dimensional scale representations of the internal layout of buildings, viewed from above. An example, used in evaluation, is shown in Figure 32. They are widely used as maps for navigation and in architectural design. Because they are to scale and convey information through the layout and positional content, they represent a different problem to the other diagram types: they are pictorial information types, according to the framework described in Chapter 2. In floor-plans spatial information is intrinsic to their information content, not a way to structure or present the actual content. By comparison, for electronic circuits and UML diagrams the layout and position of items is arbitrary (or has defined semantics, as in UML Sequence diagrams, that can be expressed in non-spatial ways such as order). For floor-plans layout is not arbitrary, so communicating it is essential to allowing users to make use of these diagram types. In addition there is information on shape and orientation. This was very challenging given that none of the tools evaluated so far before have been successful in allowing users to build spatial mental models.
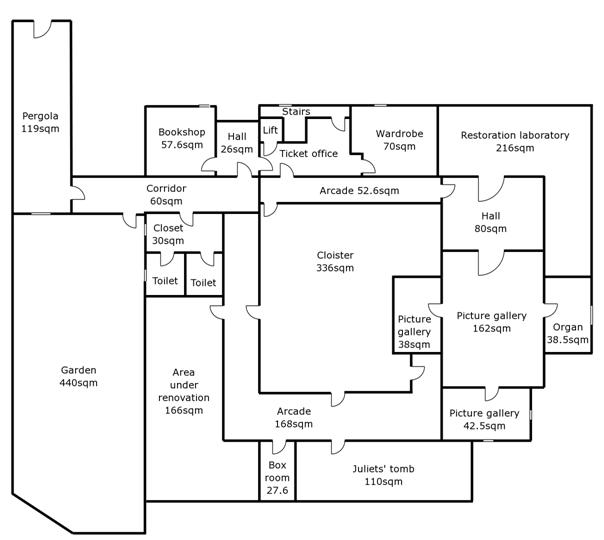
Figure 32: A floor-plan diagram used in evaluation.
To attempt to mediate this problem, extensive task analysis was employed to attempt to identify and support the diagram functions, particularly with the problem of communication of the spatial information in the diagram. Consultations with domain experts identified three tasks for which blind people might want to use floor-plans:
1. Obtaining an overview of the building’s layout. This led to the development of a Walkthrough function, enabling the user to move through the floor-plan in a first person view, and some generated summary information. The existing Map function was believed to also support this task.
2. Planning a route through the floor-plan. A dedicated Route-planning function was developed to support this task.
3. Obtaining information on the layout of a particular room. A Layout function was attempted to support this task.
Since floor-plans were acquired from image analysis, they contained no features except walls, windows and doors. However, it was possible to obtain the names of rooms and label them appropriately. Doors and windows, however, were simply numbered. This is similar to the situation with electronic circuit diagrams, where information is held in the connections between nodes, not in text within the nodes, but there is additional spatial information.
The Walkthrough function re-presented a floor-plan from the point of view of a person walking through it. This was a very simple first-person view similar to that found in computer games such as Doom (ID Games 2004). It was intended to permit blind users to gain an understanding of the layout of a floor-plan, identified as a key task by questioning domain experts. The idea was that it would provide more insight into the absolute layout of rooms and connections between them since it directly modelled real-world direction and movement in a first-person presentation. This is an emphasis on presenting the spatial layout information, rather than what the spatial layout information implies. At any one time the user was modelled as looking in a direction, and could turn left or right or move forwards or backwards. The user did not move freely in space around the diagram, but was restricted to a number of points. Figure 33 shows the layout of these walkthrough points in a diagram. If the user were in the walkthrough point in the Lounge, for example, facing north, they would be told there was nothing in the direction. Turning to the right would face the user to the east: again, nothing there. Turning to the right again would face the user south, and they would then be presented with the option of moving into the small hall. Twisting the joystick turned the user and moving it forwards or backwards walked the user forwards or backwards. Figure 34 shows how this final view was presented to the user.
A departure from the previous tools was that the walkthrough points did not correspond to nodes in the hierarchy or graphs. Instead they were generated by the system by an algorithm that worked from the doors arrayed around the floor-plan. It ensured that every room in the floor-plan with a door had at least one point, that connections between points were restricted to the cardinal compass directions (north/up, east/right, south/down and west/left), and that every doorway had a connection through it. It was therefore possible to use the Walkthrough function to move through the floor-plan to any accessible room, but a single room had any number of points, not related to the size of the room but to the position and number of doors. The unlabelled room in the centre of Figure 33 has two walkthrough points, while the Lounge has only one walkthrough point despite being greater in area. The Study has one walkthrough point, determined as lying halfway from the single door to the far wall, which happens also to be the centre of the room. However, this same approach creates a walkthrough point in the Lounge that is not in the centre of the room, but equidistant between the door to the Lounge and the far wall. The same effect causes the two walkthrough points in the Dining Room to be located at the east end of the room, generated from the position of the two doors, rather than central in the room.
This arrangement appears peculiar. First, it was designed to support exploration tasks that relied on the navigation of rooms through doorways rather than navigation from centre of room to centre of room. Second, the restriction of possible directions to the cardinal compass points necessarily required the placing of walkthrough points in locations that did not represent the centre of rooms. If always having a point at the centre of a room were desirable, extra nodes might be generated, but this would firstly add to the number of nodes required and secondly raise the problems of defining the centre of a room described below. This solution was intended to keep the number of walkthrough points to a minimum consistent with using every doorway, on the assumption that this would make exploration and understanding the floor-plan layout simpler. Other designs might involve different approaches, such as regular placing of more walkthrough points in a grid or representing doorways as nodes: this design was not chosen as part of a coherent selection process amongst the possibilities.
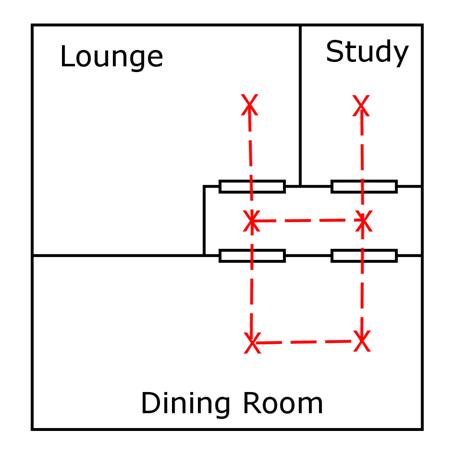
Figure 33: The walkthrough points created for a floor-plan
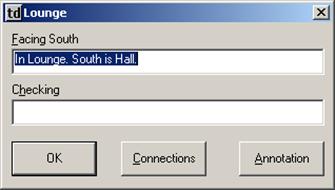
Figure 34: The walkthrough function in action
Moving between points played an immediate sound that indicated distance by volume (points further away being quieter, closer being louder). This sound was composed of a musical note repeated a number of times, the number of repeats corresponding to the distance and the duration of the note decreasing with increasing frequency so that the sound was always of the same total duration. This was intended to prevent the sound becoming an irritant when the distances indicated were large. The hat switch on top of the joystick could be used to query what points, if any, lay around the current point without having to turn the whole user. This was intended to support querying of the local area with minimal confusion for the user from changing direction and having to remember to turn back.
Another task identified for floor-plan users was the planning, in advance, of routes through the building. This was supported by a simple Route Planning function shown in Figure 35.
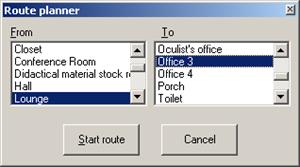
Figure 35: The route planning function in action
The user could select two rooms in the floor-plan and the system determined the shortest route between them in terms of the number of nodes that needed to be traversed to move from the first to the last node: this was believed to make sense in terms of minimising the route complexity, rather than trying to minimise distance travelled (and would often accomplish this anyway). The first node on the route became the current node, and the user could move forward or back on the route until it had been explored to their satisfaction. The intention was that this function would be very simple, moving the user from node to node to demonstrate the route, and leaving it to the existing functions (e.g. the joystick) to support the user in determining how the route should be followed.
A Room Layout function was intended to support the task of understanding the floor-plan layout, not at the level of the rooms in the building but at the lower level of the shapes of individual rooms. Since floor-plans uniquely have a spatial element (shape and orientation) not related to a simple node point location, this was a function designed to communicate this information directly using the force-feedback properties of the games joystick. Figure 36 illustrates how this operated.
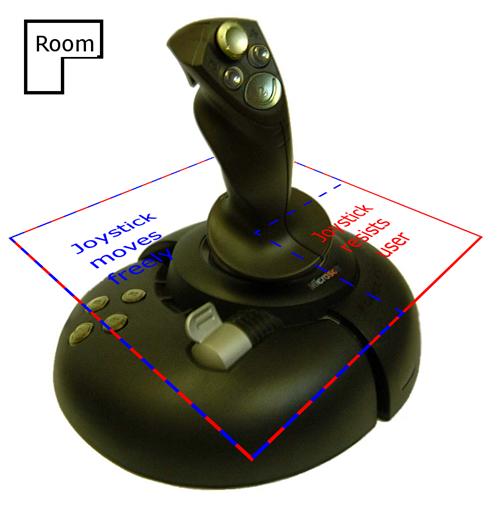
Figure 36: The room overview function.
The joystick was used to indicate the shape of the room by restricting its movement to an area that mapped directly to the joystick movement space. This was designed to indicate to the user that what area was part of the room shape and allow the user to explore its perimeter. A spatialised immediate sound supplemented the joystick action by indicating when the user had left the room shape. Finally, if the user moved the joystick to a position on the room’s perimeter that corresponded to a door in the diagram, the name of the next room would be provided and the user could use the trigger to “move through it” to the next room. This function therefore allowed the traversal of the diagram in the same way as spatial navigation. However, on testing with the experimenters, it was decided that the ability of the inexpensive games joystick to convey the shape of a room was not sufficient to make this a useful function, so it was not tested with users. The effective resolution of the joystick was estimated to be about nine “haptic pixels”, meaning that the user might be able with training to identify whether a room were a “T”, “L”, “S” or square-shaped room, but not gain an understanding of the shape of the walls that might be good enough to be useful when walking along the wall as a guide. If this is the best level of discrimination possible the shape might as well be provided to the user in text (e.g. “Room shape: T, upside down”) rather than requiring the user to painstakingly use the limited joystick function.
For the other diagram domains the spatial position of each node, represented as it is as a point in a connected graph, was clearly defined and obtained simply from the original diagram. (For the European map, the location of the capital city was used). However, for floor-plan diagrams, defining the spatial position of a room is difficult since it has area and shape. In this case the system simply takes the mean position from the outlying values of the area, which is effective for regularly-shaped rooms but problematic for rooms with different shapes. This problem is demonstrated in Figure 37. The yellow room on the left is regularly shaped, so deriving the position of the room this way works well. The yellow room in the centre is irregularly shaped so the position determined by this method is not in fact within the borders of the room, but inside another room entirely. In fact, this is a more general problem with the way the system represents nodes with area and shape (found in floor-plans) rather than simply position (electronic circuits and UML diagrams). The spatial re-presentation model assumes that diagrams can be represented as a connected graph of nodes. In this representation, in what direction would one point the joystick when in the second room in Figure 37 to indicate the top-most door into the white room? In practice, for the evaluation of the system, floor-plans were chosen that did not present these problems. In reality, this problem would have to be addressed for the spatial navigation feature to be useful. One solution might be to split irregularly-shaped rooms into regular portions and navigate between them: the yellow room in Figure 37 is shown on the right split into three nodes each with a central location within the boundaries of the node. This would increase the number of nodes and complexity of the diagram and system, but resolve potentially impossible situations. However, as it stands the spatial layout is ill-represented by the model of a graph of nodes.

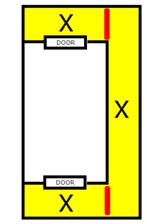
Figure 37: Defining the centre of a room. The current room (shown in yellow) and the centre of each room (crosses). The plans to the left and centre use the centre of the room defined only by the outlying coordinates of its perimeter : the centre plan shows how this can result in a centre outside the actual room perimeter. The plan to the right splits the room into parts (red line) so that for each part its centre is within the room perimeter and the part perimeter.
Minor changes were made to the basic interface to handle the different domain. In floor-plan diagrams connection information was annotated automatically with a simple relative measure of the distance between the current node and the one indicated by the connection. Like the distance-travelled information described in the Walkthrough function below, this was relative to the diagram dimensions, not to any real scale or distance. In the Map function for floor-plans, not all nodes were represented at the same size: rooms, for example, had nine times the area of other floor-plan features such as doors or windows.
There was one further complication from attempting this pictorial information source. The Compass function managed the UML diagrams evaluated with the exception of the Use Case diagrams where the layout generally has a few Actor nodes to one side and a column of Use Case nodes to the other (see Figure 24). Floor-plans had many more connections in similar directions, such as many doors off to one side of a corridor, so the Compass function frequently failed to connect nodes together and was not effective for traversing the graph.
Evaluation results for floor-plans
The DiagramNavigator 2 floor-plan tool was evaluated by TeDUB project partners and 31 blind users. Their results are summarised here: full details can be found in the project document “D5.4 Evaluation of the 2nd Prototype.”
From Section 7.3, a discussion of the results:
· “The overall consensus of the 34 participants was that the system is potentially very useful and intuitive, thus largely achieving the aim of enabling visually impaired people to interact with architectural floorplans by creating a spatial awareness.” (p105)
· “The participants also provided feedback about specific features and functions of the system they found very useful, and enjoyable to interact with. The route planning and joystick sweep features were two of these, and the reasons given to support these sentiments were that these features provided the user with a spatial awareness of the connectivity, and location between different rooms.” (p106)
· “Interaction with the walkthrough feature further presented the users in all four countries with problems, leading to it being described as difficult or complicated to interact with.” (p109)
· “The route planner was the one of the most appreciated and successful of the interactive features because it helped the user explore the floorplan by providing a room-by-room route.” (p113)
· “The text view feature was one of the most appreciated concepts in the evaluation of UML diagrams, but its application to architectural floorplans was not deemed a success. The general concept and format of the information does not lend itself to this domain, therefore it was not rated as being especially usable or useful.” (p112)
From Section 8, the conclusions from the evaluation:
· “The evaluation of the TeDUB system prototype for the architectural floorplan domain has provided a wealth of information regarding the usability of the system, and supports previous evaluations findings that the system is easy to learn and use. The studies also showed that visually impaired users could navigate the architectural diagrams in their attempt to complete the set tasks, and establish a spatial awareness of a building layout using the diversity of features. However, the features and functions of the interface, both new and old, had differing levels of success.” (p118)
3.4. Diagram access tool design: summary
The process of design and development of the diagram access tool during the TeDUB project permitted an investigation into the re-presentation of technical diagrams, a diagrammatic information source according to the model described in Chapter 2. The summary below is drawn from the author’s experience and the project partners’ findings in the user trials.
The model chosen for the re-presentation of these diagrams was based on a hierarchy of nodes. This was intended to be a familiar and useful model for blind users. Evaluation suggested that blind users were able to navigate and utilise the diagram contents. The re-presentation of the diagram as both a hierarchy and a set of connected graphs was accepted by users, although complex and unfamiliar structures caused some users difficulties. Finessing the structure of the hierarchy and graphs to create a tailored re-presentation can assist with this problem (for example, ordering nodes in UML State Chart diagrams to reflect the order the nodes are followed in time). The re-presentation reflected natural spatial and positional hierarchies in the original diagrams: it was possible to convey both aggregation/composition and connectivity through the hierarchy and graphs. However, attempting to move to a more pictorial information source, floor-plan diagrams, exposed the limitations of the model. Users were generally unable to gain an accurate and useful understanding of the layout of a diagram beyond nodes-and-connections, which is a problem for information sources where this is necessary. Tactile diagrams are an obvious candidate for communicating such information sources. Otherwise, attempting to present the spatial content of a technical diagram to blind users is inefficient and does not support practical diagram use. It is better to attempt diagram domains where visual layout and formatting is convenient and helpful for sighted people, but not essential semantic content. The visual content can be used to structure the re-presented information, as with the layout of nodes in the connected graphs, but there is little benefit to attempting to convey the spatial information itself since it is inefficient for the user to try to understand the layout of a diagram when they might be progressing with whatever actual task they need to perform. This means that maintaining the original spatial layout of the diagram should take second place to rearranging the diagram to permit the Passive joystick and Compass functions: the role of spatial layout in technical diagrams for blind people is to allow the use of convenient user interface functions, not be of itself information to be communicated.
Task-orientated design, resulting in functions that supported user tasks directly, such as the Search and Back functions that clearly support information-foraging tasks, were popular. Extending this approach to floor-plans resulted in the creation of a successful route-finding function that was popular with users despite requiring users to employ the spatial interface that was generally problematic. Functions and features that addressed user tasks appeared to be successful in evaluation and are likely to be successful in real use: those that did not were not. Tasks are often dependent on the domain of the diagram, so domain-specific functions are necessary. Other tasks, such as using diagrams for information storage, are more general, so the supporting functions – Annotation, Bookmarks, persistence of this data – are of potential use in every domain.
In practical terms, the diagram access tool appeared to be most successful with UML diagrams. Floor-plans appeared to require the presentation of too much actual spatial information for this node-and-connections software approach to be of benefit. Tactile diagrams might be used instead, since they allow the exploration of position, orientation and shape effectively. Electronic circuit diagrams contain information in the connections between nodes, rather than the nodes themselves: this means that the re-presentation of an electronic circuit as a graph may require difficult and inefficient exploration and navigation work by the user. UML diagrams in contrast can be obtained from electronic sources through a relatively simple and perfect transformation process and may be used effectively by blind users with familiar functions and approaches.
Finally, as part of the tool development numerous interface features were built. Familiar interfaces, such as features common to Windows Explorer and web browsers, were popular and appeared to be easy to use. In contrast, the problem of communicating spatial information was necessarily addressed by novel functions. The inexpensive games joysticks used appeared to be able to communicate direction in conjunction with 3D audio, but many users appeared to find the process difficult or inaccurate, especially when the interface conflicted with the user’s screen-reader. They did not appear to be effective at communicating shape or orientation. This last issue made the use of context sounds particularly a problem: sounds should be restricted to immediate sounds. Observation suggests that the interface needs to be as simple, consistent and unobtrusive as possible, even if this means abandoning more complex but potentially powerful functions such as the Locale function. While blind users are able to use spatialised interfaces they may find it very difficult to use them to accomplish anything useful.
4.A Web access tool
This chapter describes the re-presentation of a textual information source, as described in Chapter 2. The principles of this type of information source are as follows:
· The information content is largely text, structured by layout.
· Re-presentation of the information source can be accomplished by communicating this text content.
· There is no need to communicate the layout. It may be used to structure the text presented to the user.
An example of the application of this model is described in this chapter: web pages. Section 4.1 describes the problems of web accessibility, the problems blind people encounter in accessing this information source. Section 4.2 describes some of the existing solutions available. Section 4.3 describes a tool, WebbIE, developed to address some of these problems. Section 4.4 describes the lab-based evaluation of this tool against two existing assistive technology solutions, comparing its ability to re-present web pages in an accessible format against the screen reader JAWS and the self-voicing application Home Page Reader. Chapter 5 draws together this chapter and Chapter 3 and considers the implications of this work in the re-presentation of visual content to blind people.
4.1. Web accessibility
This section describes the general problems that blind people have in accessing web pages. This is referred to as web accessibility.
4.1.1. Web pages and the World-Wide-Web
HTML: text and mark-up
Web pages are a type of hypertext, human-readable documents that contain links to each in an unconstrained way. Web pages are located on computers accessible on the Internet and link to each other: a group of related web pages sharing location, appearance, theme and internal navigation is a website. The intellectual roots of web pages lie in hypertext systems like the memex proposed by Vannevar Bush in the 1940s (Bush, 1948) and HyperCard on the Apple Macintosh in the 1980s (Smith and Weiss, 1988) combined with structured document standards like Standard General Mark-up Language (SGML) (ISO, 1986). Tim Berners-Lee developed a system of hypertext for the Internet based on a simplified SGML (Berners-Lee, 1989) and the Web was launched in 1991 (Berners-Lee, 1998). This hypertext standard was the Hypertext Mark-up Language (HTML). Transported over the Internet by the Hypertext Transport Protocol (HTTP) (Fielding et al, 1999d) it became known as the World-Wide-Web. Its popularity exploded in the late 1990s and the number of web pages now numbers in the billions, a huge information resource. They are written in Hypertext Mark-up Language (HTML) defined by the international web standards body, the World-Wide-Web Consortium (W3C 2004a).
HTML combines text content with mark-up. Figure 38 shows it in use. The mark-up, in the form of elements and attributes, formats the text and provides structural and presentational information, such as paragraphs, headings, bullet-pointed lists and tables. A client, or web browser, has responsibility for rendering the content to the user in accordance with the mark-up.
<HTML> <H1 id=”heading1”>Acme Machine Operating Instructions</H1> <P>Always ensure you press the green button <STRONG>before</STRONG> the red button.</P> </HTML>
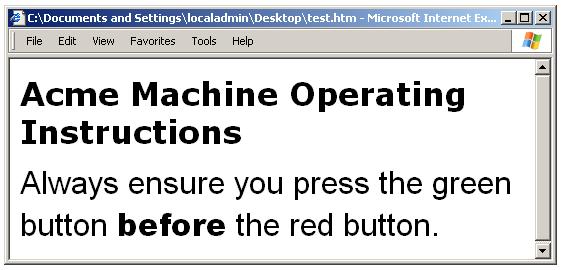
Figure 38: Sample HTML code showing text content and mark –up and presentation by a web browser. The HTML mark-up is contained in square-angled brackets, “<” and “>”. Mark-up consists of elements (e.g. HTML, H1, P, STRONG) and their attributes (e.g. ‘id’). Everything not mark-up is text content, to be displayed by the web browser in accordance with the mark-up.
The presentation of HTML by web browsers complies with print conventions for text documents: for example, headlines are rendered in a larger, bolder font, and strong emphasis is presented in a bold font to draw the sighted user’s attention. The mark-up elements available since early versions of HTML – lists, headlines, paragraphs, preformatted text, cite, code – reflect this text document bias. The actual visual presentation is left to the individual web browser: it might display a heading in capital letters, or emphasis with an underline. In practice presentation is reasonably consistent. HTML 2.0 lists the conventional visual presentation for HTML elements (Berners-Lee and Connolly, 1995) that had developed as common usage by the time of this first attempt to standardise HTML.
The theory of independence of presentation and content
The custodians of HTML standards, the W3C, explain that mark-up structures the text content. The same document can also be presented by a non-visual client using methods appropriate for the different medium but still communicating the semantics of the mark-up. For example, an audio client might read the headline in a different voice, and put emphasis (increased pitch) on reading the word “before”. Presentation is independent of content, which gives complete freedom to the client to render the information in the best way for the user. The authors of web pages, web designers, should concentrate on representing the structure and semantics of a web page in the mark-up, not how it looks. In practice, this standardisation does not reflect reality. The standardisation of HTML, based on SGML, has always lagged behind innovation by web browser developers, first Mosaic then Netscape Navigator (Connolly and Masinter, 2000): the first HTML specification, HTML 2, was released in 1995 and represented an attempt to standardise what was then common practice (Berners-Lee and Connolly, 1995). The current version of HTML is version 4.01 (Raggett et al., 1999) and it reflects the greater emphasis on semantics. For example, the presentation norms given in HTML 2 have been dropped.
The reality of HTML development
HTML and browser development has been lead by web browsers and HTML document producers, who are sighted. This means that they have used HTML to format the visual presentation of web pages. The sighted user can then infer the structure and semantics from this visual appearance. There has therefore been a tendency by web page creators to co-opt the mark-up abilities of HTML solely for creating documents that make sense only when rendering the documents visually. Web pages must be analysed using knowledge of the visual modality to understand their structure.
For example, the document fragment from Figure 38 might be coded by a web designer as shown in Figure 39.
<HTML> <FONT size=”18pt” face=”Verdana”> <B>Acme Machine Operating Instructions</B> </FONT> <BR><BR> <FONT size=”10pt” face=”Arial”> Always ensure you press the green button <FONT face=”Arial Black”>before</FONT> the red button. </FONT> </FONT> </HTML>
Figure 39: HTML using mark-up for visual formatting. This has the same visual appearance (and is therefore identical) when rendered in a visual browser as the HTML presented in Figure 38.
In a visual client the presentation of the content is the same. Instead of using the HTML “headline” mark-up to indicate the page’s main headline, the author has made the headline text bold, and a larger font size. This is a perfectly recognisable convention for sighted users, but is not useful for non-sighted users, who are forced to choose between losing this semantic information and trying to identify headings by guesswork. The heading is no longer defined, the emphasised word is no longer emphasised. The corollary of this problem is the use of semantic mark-up for purely visual effect, for example using HTML heading elements (e.g. “h1”) to change text appearance without regard for the structure of the document that might be inferred by a blind user (e.g. http://www.gamesfortheblind.com/).
How visual presentation shapes HTML
If web pages are written to make sense when viewed, there is no reason for web designers to respect the semantics of the mark-up or to reflect the structure of the page in the HTML code. This means that the accessible mark-up no longer reflects the page’s semantics or structure. HTML therefore ceases to be able to be transformed into a meaningful representation for blind people. For example, the use of visual formatting also has adverse effects on higher-level document structure. HTML contains a number of ways to structure documents according to their content. Six levels of headings and the “DIV” element provide for the division of web pages into sections and chapters like a conventional book or document. If HTML documents employed these elements they might be used to create indices and access points into the document, as attempted in web browsers for the blind such as IBM’s Home Page Reader (IBM, 2004a) and in the XHTML compliant with the DAISY talking book format (Morley, 1998). However, instead of using this mark-up for structure, web designers use visual presentation to create a web page that when displays structure only when rendered. The HTML code used to do this has changed, but the most common technique at present is to use HTML tables. These are best suited to containing information presented in a tabular format (for example, sets of figures). They are used as layout containers to position content on the screen for the visual user. Figure 40 gives a simple example.
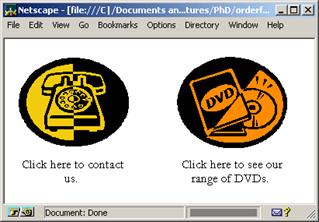
<HTML>
<table width=”100%”>
<TR>
<TD width=”40%”>
<A href=”address.htm”>
<IMG src="phone.gif">
</A>
<TD width=”20%”>
<TD width=”40%”>
<A href=”catalogue.htm”>
<IMG src="dvd.gif">
</A>
<TR>
<TD width=”40%”>Click here to contact us.
<TD width=”20%”>
<TD width=”40%”>Click here to see our range of DVDs.
</TABLE>
</HTML>
Figure 40: A web page and its HTML code. A table is used for layout. HTML tables consist of rows (TR elements) containing cells (TD), hence the left-to-right layout of content. Note the use of widths to lay out the content as desired and the empty spacer cells (“<TD width=’20%’> ”).
It is obvious to the sighted user from the position of the images and the accompanying text that each image is matched with the text below it. However, examining the HTML shows that the series of elements is not image – text – image – text but image – image – text -text, shown in Figure 41.
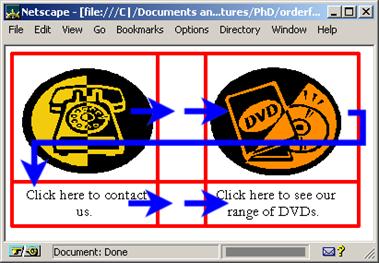
Link to address.htm Link to catalogue.htm Click here to contact us. Click here to see our range of DVDs.
Figure 41: The underlying order of cells in the HTML code presented in Figure 40 and how the page might be presented to a blind user. The table is shown in red and the order of cells indicated by blue arrows.
When rendered by a non-visual browser, the content of the table will match the order of the table cells, so the user will be given two links and then two pieces of text and will have to work out themselves what text goes with what link. The normal flow of a document is disrupted when viewed in the linear manner required by a non-visual client. In addition, dedicated mechanisms for navigating “real” tables using HTML features (e.g. Oogane and Asakawa, 1998; Pontelli et al., 2002) such as informative column and row headings are frustrated, since the majority of tables encountered are not in fact tables of information but layout features. Despite all these drawbacks, tables as a layout tool are enormously popular with designers because of the precise control of visual layout they afford, a popularity extending even to the RNIB website (RNIB 2004a).
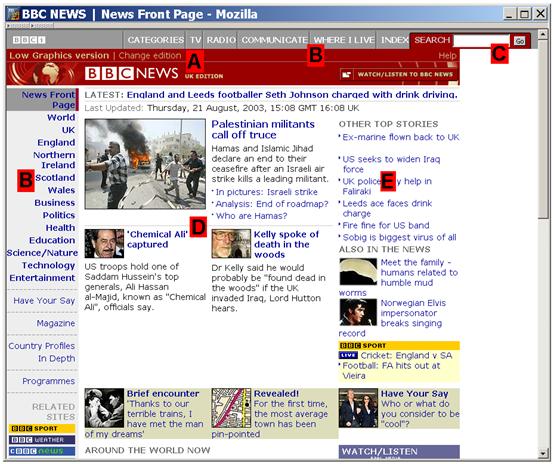
Figure 42: A visual HTML client displaying a web page. This has been laid out using sixteen tables and has a two-dimensional visual structure.
Figure 41 is a trivial example of the problem. A real world example of a web page employing visual layout to structure a web page is shown in Figure 42. Here the web designer has used sixteen tables and many DIV elements to create a complex two-dimensional web page layout. Colour, position and grouping are all used to segregate different parts of the page and indicate structure. For example, a sighted user might identify the following components:
A. The page identity, “BBC News”, displayed in large capital bold letters: this is in fact not text at all, but an image, and thus not available to non-visual clients. It is not marked up as a headline or otherwise identified. [13]
B. A series of links down the left-hand side and across the top that provide consistent navigation throughout the site.
C. A search box, allowing quick access to the contents of the entire website.
D. Three main articles, each with a headline, illustrative image and link to that article. The article titles are not marked up as HTML headings and the articles are not differentiated from each other by the structuring HTML DIV element. Tables are used to divide up the articles, but it is impossible to tell this from the HTML code.
E. Links to other articles on the site.
Further examination will lead to the identification of other features.
How sighted people use visual presentation
The sighted user does not have to perform any complicated tasks to understand the structure of the web page shown in Figure 42 because a sighted user can see it. Sighted users can, on first seeing a webpage, quickly identify the salient features – for example headlines, navigation bars, main text content, advertising – and therefore the meaningful content of a webpage and how to access it. This is demonstrated by commercial studies, such as Schroeder (1998), which indicate that position on the page determines reading order (centre read first, then left, then right) and that sighted users treat the edge of advertisements as delimiters of the area of content of interest. This behaviour is learned very quickly by new sighted users, who start off trying to read the page in a linear fashion but quickly adapt to the dominant convention. Sites often rely on advertising revenue, which requires (sighted) users to view and click on advertisements. Sighted users ignore advertisements and other irrelevant website features, even when designers try using animation to attract attention (Bayles, 2002). Empirical studies using eye tracking, such as that reported by McCue (2003), indicate that sighted users have developed assumptions about webpage design and use these, consciously or unconsciously, when navigating web pages. Advertisements in the same position on the page are ignored. Sighted users look first to the centre of the page, then to the top-left where the logo often resides, then to the left for the navigation menu. Great quantities of information confuse people and induce rapid scanning of the whole page. Pages that comply with visual conventions are easier for sighted people to use but new users quickly pick up these conventions (Pearson and van Schaik, 2003). What the sighted users are doing is performing information foraging and other tasks. They are visually searching the web page for the text or form elements that are of interest because they will help them to complete a task, be it finding a recipe or sending an email. This information on the web page that is designed to be of immediate use to the sighted or (or more correctly will determine the usefulness of the web page to the user) is the content of interest. Sighted users can quickly identify this content and take advantage of it. The content of interest is static, even if the user has switched their attention to trying to find different information (for example when the user has examined the content of interest and found it to be of no value and wishes to move elsewhere, so starts looking at the navigation bars). This is because web pages are static, and the content of interest is determined by its visual presentation, determined by the web designer, not the user’s immediate needs, which will change.
It is interesting to consider which came first, convention or behaviour: did the web design community form the convention that users have learnt, or do users and designers naturally place information of interest at the centre of the page? In fact, it seems likely that designers followed their own visual sense when first placing navigation content to the left or right and content in the centre, so the convention and practice grew up together.
The problems of visual presentation for blind people
The experience of a blind user will be different. A document such as a plain text file or a word-processed document can be navigated in a linear manner from one end to another, and all the information in the document will be available. There may be structure within the document – headlines, chapters, sections – but a one-dimensional re-presentation of the structure available to a blind user maintains this structure [14]. Web pages, however, are structured in two dimensions – headings, navigation bars, side panels – so no such approach is possible. The placement of document components such as paragraphs, headings or pictures freely on the canvas permits designers to create for a two-dimensional modality, sight, and necessitates those not using visual means to access web pages either to infer the structure of the web page or to ignore much of the available content. A blind user moving through the page HTML element by HTML element will come to the first article headline, “Palestinian militants call off truce” only after the search box and the two navigation bars, meaning forty links must be listened to and moved past. This assumes that the user can tell the start of an article when it reached: the headlines themselves are not marked up as headings, so there is no way to differentiate them from what has gone except the fact that they are not links. There are many ways to ameliorate this problem, many employed by this site, but it illustrates the basic problem: blind users lack access to the page semantics and structure because they are visually-presented. The RNIB state in regard to their web design policy: “HTML is not inherently inaccessible…It all comes down to how [it is] used.” (RNIB, 2004b)
There exists a tension between visual readers (who prefer a certain number of words per line (e.g. Bernard, 2003)) and visually-impaired users (who want to leave it to the browser and want their text unadulterated). A web designer might use tables and artificial cut text into chunks to create easy-to-read text: this will be a problem for blind users. Jacob Nielsen writes on web design and accessibility, but recommends “Don't use a heading to label the search area; instead use a ‘Search’ button to the right of the box.” (Nielsen, 2003a) to simplify the interface for the sighted user: however, a linear progression through the HTML code by a blind web user will result in the text box being encountered before the indicating button [15]. Ivory and Hearst (2002) found that the better a web page design was regarded by web designers the less accessible it was. Another problem arises with anti-robot measures, where websites attempt to stop malicious automated use of their websites (e.g. to create email accounts for use in spam) by using images rather than machine-readable text (May, 2003).
4.1.2. Web Accessibility and Usability
There are therefore two challenges for blind people accessing web pages. The first is the fundamental problem of accessibility. This is the problem of presenting the content of a web page to a blind user. This must overcome inaccessible content (such as images and other embedded content), content that is difficult to present (such as frames and forms) and ensuring the presentation is itself accessible to a user’s screen reader. Success in accessibility relies on the user’s web browser and the web page’s web designer (e.g. provide text equivalents for any important images). This is generally a binary problem: blind users can either access the content or they cannot.
The second problem is one of usability. This stems from the visual presentation of web pages for visual users demonstrated above. Even if the contents of a web page can be read by a blind user, the process may be so difficult and time-consuming that the user abandons their efforts. No-one suggests that HTML is accessible because a blind user could read the HTML source code, but it is all in plain text: the presentation must be accessible. Usability is a question of degree, and has a continuous distribution depending on factors such as the site’s presentation, the user’s ability and the task that the user is attempting. For example, the BBC web page presented in Figure 42 is accessible, despite its complexity. Whether it is usable depends on many factors. Comparisons can be drawn with attempts to provide web access on mobile telephones and other small devices for sighted people (e.g. Watters and MacKay (2004)). Users will not use the Web if the interface is inefficient and difficult. One solution is the Opera browser, which re-presents the web page content in a linear format, making it similar to the experience of blind people accessing web pages. Opera’s guidelines for making web pages (Opera, 2004a) are very similar to guidelines for blind people, but move beyond the basic requirements for accessibility (e.g. alternative information for image content) to encompass usability (e.g. creating a structure that is easy to navigate and clear). If web accessibility improves then web usability will be the next target. Web standards, such as the W3C, do address usability in their guidelines, but these semantic decisions are often overlooked in favour of the automated box-ticking possible with automated solutions.
There is therefore more to the Web than the accessibility of individual HTML documents. Usability depends on the task the user is attempting to complete, and the task depends on the type of web page. The majority of web pages are content pages, hypertext nodes in a huge connected graph, the Web. They contain navigation information and content. The content is the reason for the web page’s existence. Users navigate through these content pages with information goals, seeking information. They employ information foraging techniques. Hypertext is good for these open foraging tasks in sighted people (Chen and Rada, 1996). Typical user behaviour involves starting at a search engine or other rich source of links and exploring web pages until the information being sought is found (Pirolli and Card, 1999; Nielsen, 2003b). There are several factors in the efficiency of this behaviour: many are unrelated to the user, such as the speed of the network in delivering new pages to view. However, of vital importance is the ability to identify whether the information being sought is located on the current page, (sampling in information-foraging theory). This is the content of interest. Sighted people have strategies for searching for this content, and can do it very quickly because web pages are visually presented for their convenience. Blind people have considerable difficulty because the content of interest is not explicitly marked up. Content on the page that is not the content of interest is extraneous: this includes advertisements and navigation bars. Sighted people have techniques that allow them to ignore these features. Blind people are forced to process the page to find the content of interest, which can be very slow and very inefficient. Watters and Mackay (2004) identified three types of web page layout in a random sample of twenty-five sites: linear, broadsheet and navigation (in that order of frequency). This successful attempt to classify, although limited in size, suggests that a clear and effective convention for web page layout for sighted people has developed. However, the convention is for a two-dimensional layout, and this means that blind users can be forced to move laboriously through the text of a webpage, perhaps starting with a navigation bar with fifteen hypertext links, then some advertising copy, until they encounter the content of the page which may or may not be useful to them. This can be a slow and frustrating process. One solution is to perform a process of segmentation on the web page by analysis of the HTML code: however, many rely on standard formats or are restricted to defined domains and so are not fully automated solutions. Ramakrishnan et al. (2004) describe a process that attempts to handle arbitrary documents based on the identification of recurring structures in the code, assuming that these represent segments when rendered on the screen. This contrasts with the argument in this thesis that the rendered visual display of the web page structures the page (although they are not mutually exclusive).
The Web could be represented as a diagram, and the representation of hypertext systems in diagrammatic form has been investigated (e.g. Marshall and Shipman, 1993; Mukherjea and Foley, 1995) Parallels might then be drawn between navigation between web pages and travel or navigation in the real world (Goble et al., 2000). However, this would be to claim that there is a spatial element to the Web, and spatial representations of the Web are not used by sighted or blind people to any great advantage. The size and interconnectivity of the web means that no sighted person can see enough of the graph for them to be able to employ visual techniques, so they use search engines reliant on text analysis in a similar way to blind people. This might be different for individual websites, where diagrams of the site are popular, but generally users only use site maps when they have exhausted other possibilities (Nielsen, 2002). Because sighted people cannot see the web the diagram theories proposed by Bennett and Edwards (1998) do not apply [16]. Because there is only one task on a web page, identifying the content of interest, diagrammatic theories do not apply. This does not mean that spatial abilities are not important: a review of the literature of hypertext in Chen and Rada (1996) found a relationship between spatial ability and efficiency of hypertext. Whether this means that users with good spatial abilities take advantage of hypertext or the additional complexity impedes people with poor ability is not known, but it seems likely that both factors apply. Blind people can use spatial information, but may have problems, so anything requiring spatial ability, such as navigation, should be supported by dedicated functions. Web page accessibility has been examined as a problem of intra-page rather than inter-page re-presentation. This is because inter-page navigation is implicitly handled by the presentation of the hypertext with embedded links. The efficacy of such links is a problem for both blind and sighted people.
Finally, web users do not necessarily spend their time visiting many web pages in information foraging activities. While most websites consist of content pages, some are service websites. These offer some functionality over an HTML interface, such as email (e.g. Yahoo! Mail, 2004a) or commercial services (e.g. Amazon, 2004a). Search engines (e.g. Google, 2004) are the most visited service websites (JD Power, 2004). The distribution of website traffic on the internet observes a power law distribution (Adamic and Huberman, 2001). Users visit a few sites a great deal and most sites very little (Cockburn et al. 2003). Service websites are some of the few sites visited often (JD Power, 2004; Tauscher and Greenberg, 1997). The problems of accessibility and usability are particularly exacerbated for these sites. They provide functionality and so tend to use more technical and advanced HTML features, such as forms and (especially) scripting. They often provide interfaces with many functions, so can have complex web page designs: the Yahoo! Mail Inbox page has nineteen input buttons, five drop-down menus powered by scripts and eighty-eight links (Yahoo!, 2004a). This means that blind people frequently cannot use these websites.
4.1.3. Web standard solutions
The problem of visual versus semantic mark-up has been recognised by the W3C, and new standards developed more formally to divide content and presentation and encourage designers to produce semantically-meaningful HTML. This is intended to support alternative user agents, such as audio web browsers, and to allow more efficient machine-identification of document semantics and content, seen as key to indexing and organising the Web (e.g. Berners-Lee et al. 2001). This approach is based around the Cascading Style Sheets (CSS) standard (Bos et al., 2004a), a mechanism for the provision of formatting information for a particular medium to an HTML document. A CSS style sheet contains information on how the author wishes the web page to be presented by the client. They can be created for any client type, so a style sheet for a visual client (visual style sheet) might instruct the client to use a particular font or colour combination, while a style sheet for an audio client (Aural Style Sheet) instructs it to use a particular voice or volume (Bos et al., 2004b) [17]. This is intended to allow the end user the choice of whether to appreciate the document as intended by the author or to access the content in a manner more desirable or practical for the user. It also moves HTML away from the linear text-document model, and comes at the same time as another SGML language, XML, is being touted as a replacement and upgrade for HTML as a more flexible way to structure both text and non-text information. XML structures documents and XSL controls their presentation as HTML structures web pages and CSS controls their presentation. In theory, with CSS and HTML a web designer can specify complex visual layouts while creating HTML with an internal structure that reflects how the document should be read and understood on a semantic level. Simple visual preferences, like font size, spacing and colour can be set, so designers can use headline and DIV structural mark-up while remaining confident that the appearance of the headline text will be as desired. CSS also controls positioning on the webpage canvas. For example, a designer can use CSS to place navigation bars or create scrolling sections without tables and frames and with the content of interest at the top of the HTML document. CSS allows web designers to visually present web pages but leave semantics and structure in the mark-up. However, there are significant problems of non-compliance with the CSS standard by web browsers that have retarded take-up of the technology (WestCiv, 2004), and as evidenced with WCAG-compliance, the ability to create semantically-meaningful HTML code does not mean that it will be done.
Using the Web standards
Most of the problems detailed above can be ameliorated if web designers avoid inaccessible designs and utilise accessibility features present in recent versions of HTML. These are codified in a number of standards, notably the “Web Content Accessibility Guidelines” from the W3C (Chisholm et al., 1999) which provide a checklist of recommendations. These include such techniques as not relying on colour alone to convey information (e.g. “Late trains are shown in red”), the provision of alternative text to images with the “alt” attribute, providing accessible alternatives to JavaScript use, offering the means to access the main content of a page, and correct use of meaningful HTML elements like the page title. There are many other guidelines, some drawn up by standards bodies and some developed and tested by heuristic processes (e.g. Borges et al., 1998). A taxonomy of web design guidelines is described in Scapin et al. (2000).
While disability legislation and lobbying by pressure groups and individuals has made accessibility a key factor in web design for many large organisations, companies and government websites, it does not necessarily follow that compliance with these standards results in an accessible website. If accessibility is considered to be a matter of ticking the appropriate boxes rather than addressing the likely needs of visually-impaired website users then usable web pages are unlikely to result. Many of the guidelines require some design expertise to implement in a helpful way, such as “3.5 Use header elements to convey document structure and use them according to specification” or “13.4 Use navigation mechanisms in a consistent manner”. De Souza and Bevan (1990) studied three user interface designers and found that the designers had great difficulty in interpreting and following guidelines provided in the course of the experiment. Guidelines would be good if followed, but generally they are not because of cost, time, effort and lack of ability.
Nonetheless, numerous tools based on these guidelines have been developed to help designers create accessible web pages. The Bobby system (Watchfire Corporation, 2004) tests a web page for compliance to the W3C or US Section 508 standards (CITA, 2004) and there are many other similar examples (e.g. Cynthia Says, 2004; Hermish, 2004; NIST, 2002; WAVE, 2004). However, there are problems with reliance on these automated solutions. First, because these systems are not sophisticated enough to ensure that some accessibility tasks have actually been required, they can generate spurious warnings. For example, a JavaScript function might be used by a designer to make the mouse pointer change when in a different area of the screen, a purely visual effect: its presence will trigger a warning from Bobby, which the designer will need to ignore. Care must be taken by the designer to not become accustomed to ignoring warnings. Second, even if websites pass the checks, what has been done might not be of practical use: labelling every image on a page with the “alt” information “Image” will allow a page to pass the automated tester, but not be any use to a user.
Ivory et al. (2003) review these design tools and automated solutions that attempt to transform web pages to be compatible with the guidelines. Evaluation of some of the design tools with web page designers indicated that they did not help in addressing fundamental, high-level accessibility issues such as page complexity or structure. The designers did manage to improve the usability of the websites they worked on, but the tools did not support this except to reduce the number of HTML syntax errors introduced. The extra time taken to use the tool was not made up for by increased productivity and the increased number of errors communicated to the designer. Similarly, the Disability Rights Commission (2004) found that automated tools did not identify most accessibility problems, instead alerting designers to HTML syntax violations. The W3C observed that the problems encountered were covered by their web standards, but these standards had not been applied (W3C, 2004b).
The design tool used by designers to create web pages can influence whether the pages it produces are accessible. For example, a design tool might require alternative text to be entered as part of the process of adding an image to a web page, a simple test for compliance with WCAG guidelines might be built into the program, or alerts and prompts might alert designers to accessibility problems. (The accessibility of the design application itself is another issue). The ‘A-Prompt’ application, for example, (A-Prompt, 2002) runs on HTML files, highlights any problems and identifies required manual checks. Other similar applications include ‘PageScreamer’ (Crunchy Technologies, 2004) and ‘ACCVerify’ from HiSoftware (2004). The W3C has produced another set of guidelines, the “Authoring Tool Accessibility Guidelines” (ATAG) (Treviranus et al., 2000), which describe how design tools might handle web page creation while including support for accessibility as part of the process. However, although a number of supporting tools and evaluation programs are listed by the W3C, they are unable to point to a design application that implements these guidelines: “As of the last revision of this document, we were unaware of any single authoring tool that fully supports production of accessible Web sites.” (Treviranus et al., 2000).
4.1.4. Non-HTML accessibility problems
The problems discussed so far have related to the problems of making HTML accessible to blind people. There are other accessibility problems with the web unrelated to HTML itself.
One obstacle to the use of web pages by blind people is the embedding of non-text content into HTML documents. The most obvious example of this is the use of images, used not only to present pictures and diagram graphics, but again as a way to provide absolute visual layout of other components; headings and text with the size and font desired by the author; and decorative features such as borders and bullet points. Bitmap graphics contain no useful information for visually-impaired people: at best, the meaning of the image can be inferred from the filename (e.g. “border.gif” or “cat.jpg”). Other types of embedded content, for example Java applets or Macromedia Flash animations, are not rendered natively by the client browser but rely upon the action of a plug-in, a supporting application that can process and present the embedded content. This allows complex applications to be embedded into web pages, downloaded and run by the user on request. An example is shown in Figure 43. These have been used for games and animations in web pages, but improvements in the technology have lead to some websites using plug-in content to provide all the website content, using HTML only to wrap the plug-in content and provide a delivery mechanism. This is most common with Macromedia Shockwave Flash content, which provides feature-rich content that the designer can be assured will be displayed identically on every platform. The accessibility of embedded content depends upon the supporting application and the nature of the content. For example, Java applets prior to Java version 1.2 displayed content using native operating system controls, such as buttons or text fields. If the operating system is accessible, then the applets may be as well (Chisholm et al. 1998). Java applets from Java 1.2 onward use lightweight controls implemented purely within Java (Swing components). These can have extra accessibility information, but they are supported only by screen-readers such as JAWS which have been written to take advantage of this extra information via the Java Accessibility API (Sun 2004a). Screen readers that do not use the Java Accessibility API will be less successful than before. In either case, if the Java applet is used to display non-accessible content, such as animated images, the accessibility of the content interface is moot. Macromedia has introduced usability requirements and an accessibility API only recently (Macromedia, 2004a).
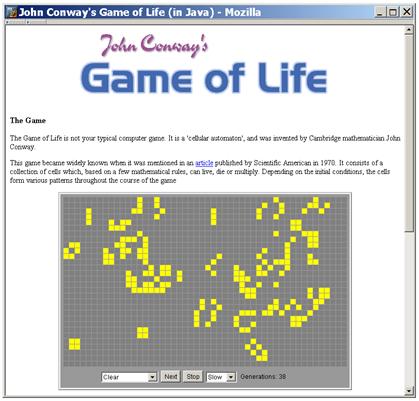
Figure 43: An embedded Java applet providing the user with an application (the "Game of Life" simulator at http://www.bitstorm.org/gameoflife/)
HTML does provide mechanisms for annotating this embedded content: the HTML specification states that an author can set the “alt” attribute (or “longdesc” for longer descriptions) of an embedded content element to “let authors specify alternate text to serve as content when the element cannot be rendered normally” (Section 13.8 of Raggett et al., 1999) or indicate that the content is of no value to a non-sighted user (e.g. an image used as a background spacing element). However, use of this attribute is not mandated by the HTML specification, and even if “alt” text is provided, there is no guarantee that its information content is equivalent to the embedded content. A dynamic user interface written in Shockwave Flash cannot be replaced by a line of explanatory text. Of course, some content has no non-visual equivalent: a website for an art gallery could provide detailed “alt” text for each image, and while this is not the same as visual enjoyment of an image this is not a problem that the designer can be expected to resolve.
The problem of embedded content is both simpler and more variable in outcome. A confusingly-laid-out page can be used with effort by a blind person. An image without “alt” text simply cannot.
A second accessibility problem is the widespread adoption of what is termed Dynamic HTML (DHTML), the inclusion of event-driven code, typically JavaScript [18], into HTML documents to add functionality to HTML’s hypertext (Netscape 2000, ECMA 1999). JavaScript code is written in an HTML document or referenced from it. When a compliant client loads the HTML document it interprets and executes the code. This allows designers to create websites with dynamic features familiar to users of GUIs, such as drop-down menus and mouse events, depicted in Figure 44. The great majority (94%) of web users employ browsers that support the technology (TheCounter.com, 2004). However, DTHML creates three problems. First, it increases the complexity of web pages, adding active and dynamic features such as controls, functions, active areas and mouse effects. Second, content may be created by the web author that is inaccessible to users who cannot use a mouse. For example, navigation of a website may be accomplished by drop-down menus implemented in JavaScript that cannot be activated without positioning the mouse pointer over the menu. Third, it requires more of the user’s web browser. For example, JavaScript may be used to test that the user’s client conforms to a standard set by the web designer and deny access to the website to users of non-standard accessible browsers (e.g. http://www.hotmail.com). Some pages may not work, such as those that use buttons that call JavaScript functions rather than submitting forms (Hotmail again). A more subtle problem arises when JavaScript is used to update page content based on user actions, such as selecting an option from a drop-down menu. Figure 45 shows the use of JavaScript to change the page content. This is a problem for accessible browsers that capture and re-present the web page once, assuming that the content is static. This is therefore a particular problem on service websites.
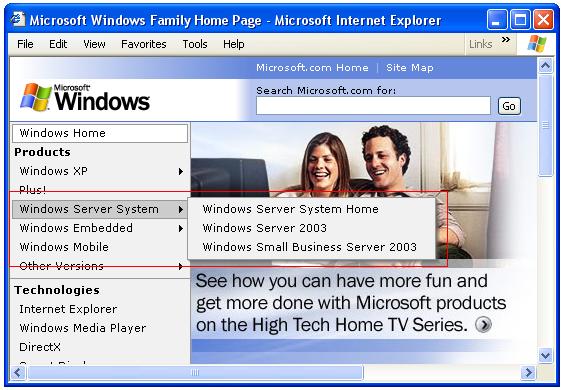
Figure 44: A web page using DHTML to create a mouse-operated pop-up menu. The red rectangle indicates a two-level drop-down menu in action.

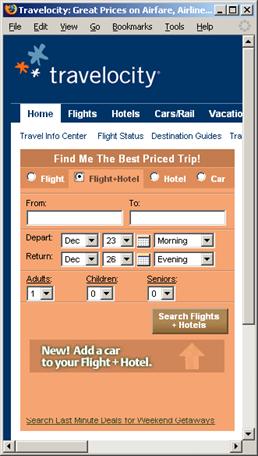
Figure 45: JavaScript changing page content without loading a new HTML document.
4.1.5. Web browser accessibility
A final accessibility problem originates with how popular web browsers display HTML documents. Designed for sighted users, they typically paint or render content onto a read-only canvas intended purely for viewing. This canvas lacks features required by screen readers, such as a caret or the ability to set the interface focus on text content. Microsoft Internet Explorer, for example, provides no way to set the focus or locate a caret in the text content of any page: it is possible to tab through links and form elements, but text elements are skipped. There is no caret, so text cannot be highlighted or selected to reading. The default user interface of common web browsers is inhospitable to anything other than visual access, despite W3C standards on web browser accessibility (Jacobs et al., 2002). Section 4.2.1 describes the impact on screen-reader users.
4.1.6. Accessibility studies
There are many potential accessibility problems with the Web. A report from the Disability Rights Commission (2004) attempted to ascertain their impact upon blind people. The report contained information on self-assessed task completion, shown in Table 1.
Table 1: Ability of different impairment groups to complete tasks on the Web.
| Impairment Group | Tasks succeeded | Tasks failed |
|---|---|---|
| Blind | 53% | 47% |
| Partially-sighted | 76% | 24% |
| Dyslexic | 83% | 17% |
| Hearing impaired | 85% | 15% |
| Physically impaired | 85% | 15% |
| All impairments | 76% | 24% |
This appears to show that blindness is the most significant impairment for potential web users (amongst these impairment groups). This is unsurprising given that web pages are designed to be viewed. Blind users also scored the lowest for ease-of-use ratings.
A further test compared blind and sighted people on three high- and three low-accessibility sites. Blind users took longer to complete tasks and while both groups completed “nearly all” their tasks successfully on the high-accessibility sites blind users failed to complete their tasks on one of the three low-accessibility sites.
Table 2 is reproduced from the report and indicates the frequency of key problems. Users’ screen readers or browsers unable to handle HTML documents presented by browsers, and frames, links and images lacked labels and alternative text. Users also had usability problems, such as difficult page structures or navigation. This suggests that accessibility has not been fully addressed by screen readers. It may be that as web design and screen readers improve then the usability problems will become more prominent.
Table 2: Key problems experienced by blind people (number of instances in brackets). Reproduced from Disability Rights Commission, 2004.
Incompatibility between screen reading software and web pages, e.g. the assistive technology not detecting some links, or it proving impossible to highlight text using text-to-speech software | 26 |
Incorrect or non-existent labelling of links, form elements and frames | 24 |
Cluttered and complex page structures | 23 |
“alt” information on images non-existent or unhelpful | 16 |
Confusing and disorienting navigation mechanisms | 16 |
SciVisum (2004) assessed website usability. First, 105 websites were selected across eight categories as “leading” companies and organisations, which were assumed to have high standards of accessibility. They included large online retailers, utilities companies, and central and local government sites. 79% failed the W3C accessibility standards. Local government did best (40% failed), travel and finance websites worst (100% failed). The biggest problems by far were missing “alt” text on images and other embedded content (68% of sites tested), and reliance on JavaScript to use the site (63%). The next most significant problem was unnamed frames (13%). 53% of sites failed on multiple points. Second, 111 websites that claimed compliance with the W3C standards were tested: these were largely public sector and not-for-profit organisations. Of these, 40% failed the standards they claimed to follow. Again, missing “alt” text (30%) and reliance on JavaScript (23%) were the biggest problems, but they were less prominent than in the first trial. This may be simply that these sites were less likely to need functionality from JavaScript, being public-sector and providing information rather than commercial, and had fewer images or were better at giving them “alt” text.
Examining the actual problems encountered in both these studies illustrates the two levels of web accessibility, accessibility and usability. The top problems were related to basic accessibility issues: images without “alt” text and lack of an alternative to JavaScript. However, lower down the list are problems relating to usability: the SciVisum report described problems with “Meaningless link phrases”, “No explicit labels on forms”, and “Missing table summaries”. These all make it more difficult for users to understand and use web pages even where they have complete access to the content, because they do not have the benefit of seeing the visual presentation of the page. As progress is made with the help of automated validation services and better design tools then the basic problems of accessibility (missing “alt” text) may fall. The problems of usability will then be more prominent, and may be harder to address since they require expertise and design rather than simple compliance with checklists.
Sullivan and Matson (2000) used the same automated W3C-compliance tools, but standardised the number of standards infractions by multiplying them by the potential points of failure: a page with a single inaccessible image (score 1 times 1) therefore scored better than a page with fifteen images, of which five were inaccessible (score 5 times 15). This caused them to identify a continuous rather than discontinuous range of accessibility. This better reflects reality (some pages are more difficult to use, some impossible) than accessibility standards (pages are accessible or they are not).
Finally, Berry (1999) interviewed blind web users. They reported feeling “empowered” but had problems with poor web design and the ability of their screen readers to “keep up” with web page development. The rate of change may have slowed because of the end of the browser wars between Netscape and Microsoft, which reduced the impetus for innovation.
4.2. Existing solutions for blind web users
Solutions to the problem of web accessibility can be generalised into four categories, described in this section:
1. Reliance on a conventional web browser and a screen reader.
2. Utilising the accessibility features of HTML and existing web clients.
3. Using transcoding proxy servers to convert webpage HTML into a more accessible format.
4. Using a dedicated web browser.
Finally, a brief description of the issue of generating page summaries is provided.
4.2.1. Using a web browser and screen reader
The web browser market is dominated by Microsoft’s ‘Internet Explorer’ (MSIE), versions of which hold a 94% share (OneStat, 2004). It is therefore the standard for web browsers, and web designers frequently write HTML specifically for MSIE, especially for DHTML development where the implementation of JavaScript can vary widely between browsers. Using MSIE and a screen reader therefore guarantees that a maximum of websites will work for the user, in the sense that the functionality assumed by the designer will be available to a blind user. In addition the user interface will be common to sighted people – such as those providing technical support – with the obvious exception of the use of the assistive technology.
The problem with this approach is the assumption that this functionality and content is accessible without further modification. If the web browser is inaccessible to a screen reader it is useless. For example, Oriola et al. (1998) found that MSIE was inaccessible to the JAWS screen reader from Freedom Scientific. However, progress has been made by screen-reader developers in supporting MSIE and by extension the vast majority of web users. To give one example, JAWS (Freedom Scientific, 2004) supports browsing web pages in MSIE and creates an artificial caret within the web browser canvas to provide access to all of its contents, rather than simply the components exposed naturally by the browser such as links and form elements. However, the caret does not operate as in a word processor, but moves from component to component following the linear order of the HTML elements in the code. The problem with this approach is that these screen-reader/browser interfaces are necessarily very complex to cope with the great flexibility and richness of the browser interface. Links, frames, form elements, embedded content, and the lack of structure must all be navigated by the screen-reader and its user. To provide a rough example, the JAWS 5.10 help files devote no pages to Microsoft Notepad, four pages to the document reader Adobe Acrobat, eleven pages to using Windows, sixteen pages to Microsoft Word and seventeen pages to web browsing with Internet Explorer. Using the Web may be more important than reading Adobe Acrobat files, but this does suggest that it does require a high level of complexity for what on the face of it might simply be a hypertext reader.
The same accessibility problems that affect MSIE will also apply to other visual web browsers, such as Opera (Opera, 2004b) and Firefox (Mozilla, 2004), used with their default settings. A further drawback is that screen-reader developers are unlikely to have done so much work on making their screen reader work with non-MSIE browsers with small shares of the market.
4.2.2. Utilising HTML and client accessibility features
The second approach takes advantage of the separation of content and presentation in standards-compliant HTML, and the native abilities of clients to present web pages as the user desires. This is primarily a solution for partially-sighted users with a high degree of functional vision, those able to read high-contrast or large font material, since it involves re-presentation of the visual content in the same visual format rather than re-presenting in speech or accessible text for a screen-reader. Web browsers (at least in theory) permit the user to define their own presentation preferences, for example using a particular mix of colours, fonts and font sizes. For example, a user with some functional vision might specify a high-contrast colour combination for text and background (Hall and Hanna, 2004) and a legible 16pt font (Bernard et al. 2001). Clients can also choose to ignore presentation dictates from web pages, such as stripping out decorative and confusing background images, or preventing text from blinking (potentially harmful to users with some health conditions (Chisholm et al. 1999, Guideline 9)). Some clients, including MSIE, allow the user to set a CSS style sheet to use that overrides any settings in the page with the user’s preferred presentation style. This approach does rely on web designers complying with accessibility criteria: for example, showing text at a desired font size is not useful if the designer has replaced text content with fixed-size bitmap images for the sake of appearance. The other practical problem is that users are required to specify their user preferences within the client, which is not common user behaviour and may not be possible in the user’s environment, for example where the user is on a different computer from their normal one, where the machine does not belong to the user, or where user preferences are locked by their network policy.
Clients may support blind screen-reader users by providing an accessible canvas and presentation of the page. The ‘Firefox’ browser (Mozilla, 2004) allows the user to activate a caret that can be moved around the canvas like the caret in a word processor. This provides a means to indicate to a screen reader the current content of interest and should allow a user to access the page contents. It does not solve problems with content such as embedded content or frames. This approach also fails to address problems related to the complex interfaces of many web pages that do not have a linear structure. For example, tables and page layout are generally still preserved, so the user must still search over the page for content of interest. Client accessibility features can therefore assist people with some functional vision. However, they are not yet a solution for screen-reader users.
4.2.3. Using a transcoding proxy server
The third approach places the solution between the author and the client by running requested HTML pages through a transcoding proxy server, (also called a gateway or mediator). The system is shown in Figure 46.
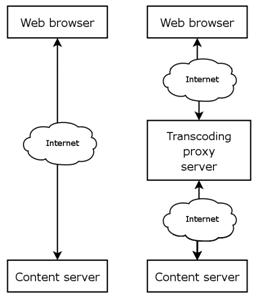
Figure 46: A standard HTML client-server relationship (left) and the use of a transcoding proxy server (right)
A request for a web page from a content server by a user’s web browser is made not to the server itself but to an intermediate server, a proxy, which fetches the web page from the content server, performs some transformation on it according to a set of rules (transcoding), and passes the transformed page to the requesting client. This allows the user of the proxy to receive content that is known to be consistent with some set of requirements met by the proxy transcoding and therefore suits the user’s client characteristics. The user navigates around the web as normal. The proxy can be configured to alter the HTML document to provide the font, font size, colour and other settings desired by the user in much the same way already described for client accessibility features.
However, in addition to changing a web page’s appearance, as achieved by using a CSS style sheet or changing client settings, a transcoding proxy can effect more change to the web page. For example, a proxy might convert every link that utilises an image to a plain text one using the “alt” attribute text for the image, or remove frames and tables to make the structure of the page simpler or more accessible (as demonstrated in Figure 47.). Changes can be made that change the HTML code, rather than simply redefining how the content is displayed. This is a more powerful approach and allows the proxy to make more fundamental changes to a web page. The proxy still usually serves HTML to the user’s web browser, so the user must have an accessibility solution that allows them to use web pages. Proxies are therefore often proposed as solutions for people with some functional vision. Some however remove the need to use an HTML document completely, such as Iliad (NASA, 2004), which provides a way to use search engines via email, sending search queries and receiving responses.
<!-- Code before action of proxy --> <!-- A link using an image --> <A href=”contact.htm”><IMG src=”contact.gif” alt=”Contact us!”></A> <!-- A table used for layout --> <TABLE width=”100%”> <TR> <TD width=”40%”>Main office</TD> <TD width=”20%”> </TD> <TD width=”40%”>01234 567890</TD> </TR> </TABLE> <!-— Code after action of proxy --> <!-- Link with image removed --> <A href=”contact.htm”>Contact us!</A> <!-- Table removed and text run together --> <P>Main office 01234 567890</P>
Figure 47: Code before and after action of a transcoding proxy server.
This process is employed for sighted users of small-screen browsing devices, such as mobile telephones, personal digital assistants (PDAs) and other consumer devices with limited screen sizes, processing and memory restrictions and limits on support on embedded content. These cannot handle fully-featured web pages and relay on proxies to transcode web pages into whatever limited format is supported by the device (Kennel et al., 1996; Brown and Robinson, 2001; Kaasinen et al, 2000). Consumer devices have very limited screen areas and hence impose on sighted users some of the constraints of blind users – for example, the inability to scan a large and visually presented 2D space for content of interest. Proxy servers that support browsing with these devices, such as ‘Webcleaner’ (2004), can also be pressed into service for blind people.
Proxy servers have several advantages. Reconfiguring a web browser to use a proxy is likely to be easier than installing a new web browser on the user’s machine but can offer similar levels of capability. Using a proxy also ensures that the presentation preferences of the user can be imposed on the web page. A transcoding proxy is platform independent as far as the client browser is concerned: because it runs remotely and returns standard HTML, the client can be operating on any platform or device that supports the output of the proxy. Finally, a proxy solution allows for collaborative solutions to re-presentation, with the proxy acting as a database and coordinator for the collaboration partners (Schickler et al., 1996; Nagao et al., 2001). Fairweather et al. (2002) discuss how if accessibility technology can be moved from the user’s machine to further up the information chain from content server to screen-reader, it can be more easily managed and outsourced to different solutions. Asakawa and Takagi’s proxy (2000), for example, in turn employs the DiffWeb proxy to identify content on a page that has changed.
An early proxy was the ‘Shodouka’ service, a service for sighted users of Japanese web pages which allowed Japanese characters to be displayed in browser clients without Japanese language support (Yee, 2003). Japanese characters were converted into images displaying the Japanese glyphs. Kennel et al. (1996) developed a proxy called ‘WAB: W3-Access for Blind and Visually Impaired Computer Users’. WAB made significant changes to HTML content in an attempt to handle inaccessible content and to improve web pages’ structure and usability. A list of all the hypertext links in the page was appended to the bottom of the page, and a link to the list was added to the top. A list of any heading elements (e.g. H1, H2) was added to the top of the document and this list hyperlinked directly to the headings in the text. Finally, page components such as links, images and form elements were labelled with text so that a screen reader could identify them even if it did not support the presentation of the component.
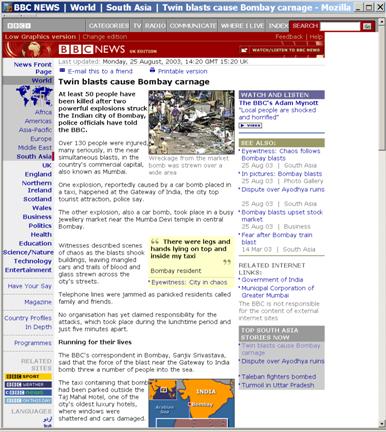
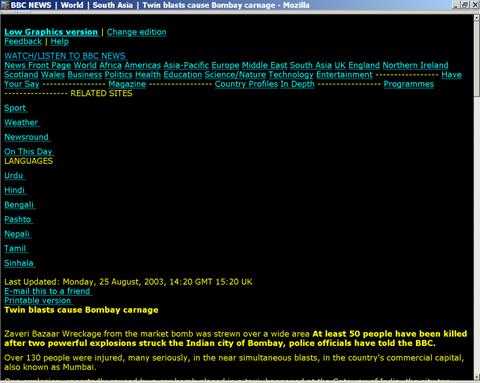
Figure 48: A BBC web page before and after transformation by the Betsie proxy.
The British Broadcasting Corporation (BBC) provides a proxy for its website called ‘Betsie’ (BBC, 2004a). This presents pages from the BBC website reformatted and altered to be more amenable to screen readers and for partially-sighted users, presenting text in large font in yellow on a black background by default and allowing users to set preferences for colour and font. Inaccessible features, such as frames and tables, are transformed into a linear presentation and JavaScript is removed. Embedded audio content, which is accessible to users with the appropriate common media plug-in, is retained. Most significantly, because the system is intended to be used for accessing the BBC website only, and the structure of these pages is a fixed and known quantity to the Betsie developers, changes can be made to the order of the contents of each web page, such as placing the navigation content at the end rather than beginning of the web page. Some 5% of the pages are reported to be unusable with Betsie because the pages do not adhere to the BBC design standard. Figure 48 shows a BBC web page before and after the Betsie transformation. The content of interest, “Twin blasts cause Bombay carnage”, is much nearer the start of the page. This knowledge about the structure of the web pages that will be transformed by the proxy allows it to employ more powerful techniques, such as re-ordering the content. The structure of arbitrary web pages cannot necessarily be so determined, so this process cannot be applied to the Web as a whole.
Huang and Sundaresan (2000) describe a proxy called Aurora. This concentrates on the re-presentation of the semantic content of the webpage. Their approach is to identify website categories, for example “search engines” or “auction sites”. Pages from a domain are transformed in a way that supports user goals, tasks and work flow for that domain. This system is therefore based strongly on a task model of web use. It manages to produce a high level of consistency of presentation of web pages from a particular domain, and removes extraneous content, but relies upon unique configuration information being produced for each and every site supported.
The ‘DiffWeb’ service (ALPAS, 2004) analyses web pages at different points in time and returns content that has changed since the page was last requested: this content can be assumed to be the content of interest in some pages, such as news sites. It is intended for use by consumer devices.
The proxy developed by Asakawa and her IBM team (Asakawa & Takagi (2000); Takagi & Asakawa (2000)) relied on volunteers or authors to provide structural annotation and supportive commentary for each website to identify the functional parts of a web page (e.g. navigation bars, main content) and provide a text alternative for inaccessible content such as images. The structure of the web page is rearranged into a different order, putting content of interest at the top of the page and moving lists of links, image maps and forms to the bottom. The proxy also identifies any changes in the current page since it was last visited using the DiffWeb service. A final set of “experience-based rules” attempts to automate the rearrangement of the web page if the structural annotation has not been done.
Vorburger (1999) describes the ‘ALTifier’, a proxy that attempts to provide meaningful replacements of images lacking any “alt” text based on simple heuristic rules. These include examining size and shape to identify bullet points and providing the title of the webpage targeted by a link to define the link destination.
The ‘SETI: Search Engine Technology Interface’ website (SETI Search 2001) aggregated the results of search engines and presented them in an accessible format. It is no longer in operation. This may be related to the success of the Google search engine since Google is text-based and relatively accessible. There are numerous other proxy solutions (Muffin, 2004, UsableNet, 2004b).
An application that sits in the category of proxy server, in that it transforms the HTML code but leaves the web browser to render the resulting transformed web pages is the ‘Accessibility Toolbar’ (National Information Library Service, 2004). This is intended as a design tool to create accessible web pages, allowing the designer to examine different page resolutions, identify structure that can be inferred or linearise the web page to see the results.
Five problems with the use of proxy servers are described in Hanson and Richards (2004). This describes the results of developing and evaluating the proxy described in Fairweather et al. (2002) and Hanson (2001). First, to correctly transform web pages the proxy was required to perform all the rendering and presentation work of a fully-featured browser, which proved very difficult to develop. Because most web pages were found not to conform to web standards, the engineering became even more difficult. Web browsers are extremely tolerant of incorrect HTML and so will render almost any page, so the transformation in the proxy frequently resulted in the loss of the original content. Second, site-specific transformation information would never be produced for most websites. Third, the transformation performed by the proxy requires the server to have full access to the content of the HTML document, which can render unusable secure transmission protocols such as HTTPS that are used in Internet commerce and for restricted access to online resources. The secure protocols encrypt the pages in transit, and the proxy server therefore cannot access and amend them. (Java is also unusable through a transcoding proxy, since the changes in the HTML code required break the Java class security model). Fourth, users could not set their web browser to use the proxy, since proxies cannot be chained and many users already used a proxy in their corporate or home setting. Fifth, the requirements on a proxy require it to have a huge capacity, since even with a limited number of users they complained of slow performance. These are considerable difficulties. [19] One that they do not address is the problem of JavaScript, which assumes that users interact directly with an intact model of the web page. This means that JavaScript functions are unlikely to work when proxy servers are used.
4.2.4. Dedicated solutions and web browsers
The final approach to making the web accessible is to use a non-standard web browser, designed for blind people or generally accessible to a screen reader, or some powerful client-side software for otherwise transforming an inaccessible web page. There are two approaches, already described in Chapter 3: creating a self-voicing application or one that is designed to be used by a screen reader [20]. The first is exemplified by the ‘Home Page Reader’ from IBM, a dedicated web browser that provides a complete audio interface to web pages (IBM, 2004a). An example of the second approach is ‘WebFormator’ from Audiodata, which re-presents the content of a web page obtained by MSIE as accessible text (WebFormator, 2004). Many non-standard web browsers have been created (lists are provided by the W3C in Bosher and Brewer, 2001; another can be found in Tiresias, 2004).
Self-voicing browsers
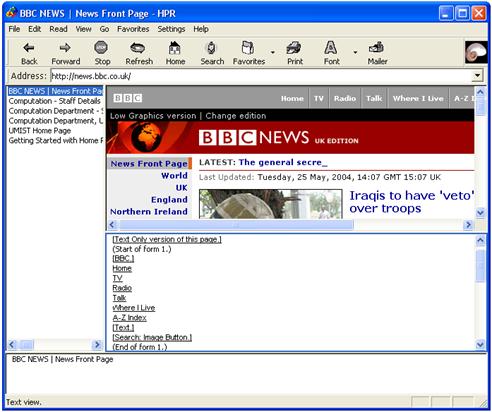
Figure 49: The IBM Home Page Reader in action.
IBM’s ‘Home Page Reader’ (HPR) (IBM 2004a), shown in Figure 49, was based on the work by Asakawa and Itoh (2000). It re-presents a web page as a linear array of items which can be moved through by the user and are voiced as they are encountered. Links are presented in a different voice (female rather than male) to distinguish them. This is very similar in effect to the operation of the JAWS screen reader. The user can select the granularity of the array, from letters upwards. The default is an array of structural mark-up elements: list items, headers, and paragraphs. This is intended to allow the user immediately to access the document via a reasonable number of segments which reflect the structure provided by the web designer. Web pages where structure is provided purely by visual presentation, not the HTML elements used, will be presented less successfully.
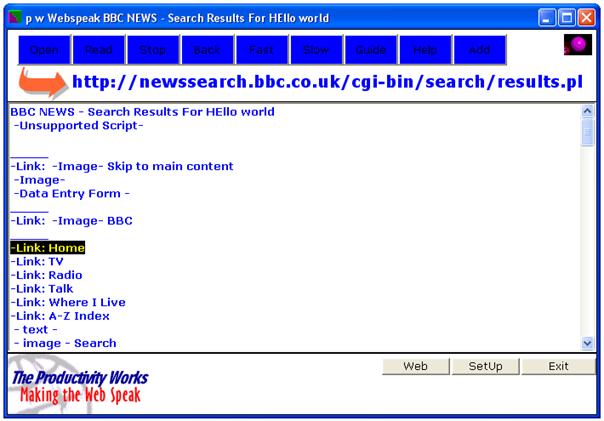
Figure 50: The pwWebSpeak self-voicing web browser.
‘pwWebSpeak’ (De Witt & Hakkinen, 1998) is a self-voicing web browser since used as the basis for a telephone-based browser system (shown in Figure 50). It models web pages much like IBM Home Page Reader as ordered linear lists of elements, and allows the user to skip to elements of a certain type. Like HPR, this assumes that the structure of a web page, which would be presented through visual means but is unavailable to blind users (Hakkinen & De Witt, 1997), is contained in the HTML structure. Oriola et al. (1998) found that blind users could use pwWebSpeak to access web pages successfully.
‘BrookesTalk’ (Zajicek et al., 1998) is another self-voicing web browser that employs a similar approach to HPR. Page contents were presented sectioned by heading, paragraph, links and other constituent parts. In addition, it attempts to provide a summary (about 20% of the original page length) and keywords for the current web page. This is intended to allow the user to make quick decisions on the relevance or otherwise of a webpage, supporting information-foraging techniques. User evaluation investigated the different ways of summarising the web pages. Headings scored most highly, suggesting that extracting title and heading information best summarizes the page. Keywords obtained from BrookesTalk scored less well, and seldom reflected the contents of the web page.
The self-voicing web browser produced by Asakawa et al. (2002) also focused on the problem of communicating information about the main page content to the user. It utilised a number of different auditory and haptic interfaces to communicate structural information derived from analysis of the HTML. It was assumed that visual users grouped visually similar elements together and this allowed them to understand the web page structure (e.g. “those link buttons make up a navigation bar”). The system performed this grouping by colour, area and border: these were identified as being the means by which ten sighted users formed groups (and in that order of importance). Colour was presented by playing a piece of background music. The content (one of link, text or image) was presented with an arbitrary auditory icon, called a foreground sound. These could therefore be combined, since they did not interfere with each other. The two sound outputs were also played to different ears to aid discrimination. Emphasis of text (one of three levels decided by font sizes) was provided by volume of another auditory icon. Finally, the size of the group was indicated by the duration of the sounds (though not all of this information was presented at once). An additional specialised haptic device was used to convey the same information through piezoelectric pins. This information was divided into two types: the macro level recognised fragmentation into discrete components of a certain type by colour and content. The micro level communicated the emphasis level of the textual information. Results indicated that the indication of emphasis was well received: it may be that this is because it allowed users to quickly identify important text and the content of interest, because important phrases would tend to be in visually-emphasised text. This is supported by the usual appearance of heading elements (e.g. H1) and guidance for web designers on visually emphasising important phrases (Morkes and Nielsen, 1997). Users were unable to pick up this emphasis information from the content alone, so this was a real improvement in the fidelity of the information received. The attempt to provide different groups by colour was less successful. It could be argued that conveying the colours and groups is less useful or requires more training than communicating the semantic importance of the different groups. In effect, the micro and macro approaches had different levels of success because they attempted different things. The micro approach used knowledge of visual perception to identify implied structure and conveyed it to the user. The macro approach stopped short of this, simply conveying visual appearance to the user rather than what that visual presentation meant, and was less successful. It might be with training, where the users learn to identify the semantic meaning of the macro sounds, but a better solution might be to attempt to determine these semantics automatically and convey this information directly. This is a visually-based analysis of the web page, where Zajicek et al. described a text-based analysis. The greater success of Asakawa et al. suggests that the visual presentation of web pages rather than content is a better guide to the content of interest, but the failure to communicate the results of analysis through a audio-haptic interface suggests that that communicating the structure rather than the appearance is the key.
An attempt to use 3D audio to re-present to the user the layout and spatial position of items on the web page is described in Gorny (2000) and Donker et al. (2002). This system used spatialised sound to communicate the position of items on the browser canvas in a two-dimensional vertical plane in front of the user. The system was evaluated with screen-reader users, who performed less well with the system than they did with their screen readers. This suggests that the spatial and layout information was not useful.
Petrucci et al. (2000) and Roth et al. (1998) report on a self-voicing web browser called ‘WebSound’. This allowed a user to access a webpage using a tactile tablet: the users presses on the tablet and the HTML element at that point on the canvas is presented with speech and non-speech sounds spatialised in 3D audio. In effect the user has a mouse pointer for input and audio for output, but of course the user cannot see what exists and its location on the canvas without exploring it with the tactile tablet. While the system was tested with twenty blind people no results were presented, so it provides no evidence that this approach was successful.
Re-presenting for a screen reader
‘WebFormator’ from Audiodata (WebFormator, 2004) uses the second tactic, running simultaneously with MSIE and re-presenting the contents in a text field that can be accessed by a screen reader. This text can be navigated with a caret as a normal text field, and users can bring up lists of links, frames and other features that can be of use in understanding the structure of the web page. It is shown in operation in Figure 51.
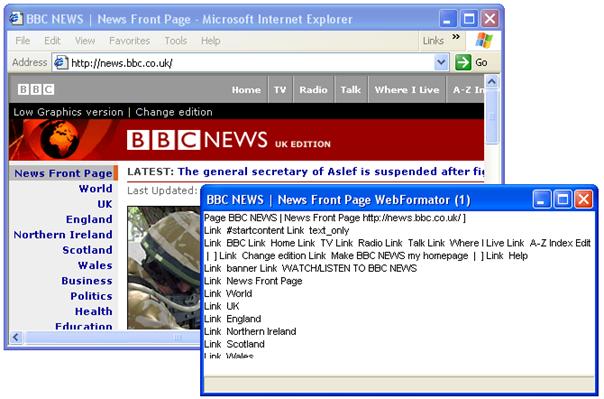
Figure 51: The WebFormator application with Microsoft Internet Explorer.
It could be argued that all would be well if only authors marked up web pages “properly”. Relying on the efforts of web designers is common. The proxy solutions in Vorburger (1999), Asakawa & Takagi (2000), Huang and Sundaresan (2000) and Fairweather (2002) all require some human annotation or the provision of extra information by designers. There are more: Filepp et al. (2002) proposed an annotation system for tables to provide additional aural information, and Shneiderman and Hochheiser (2001) proposed that each website should provide a “universal accessibility certificate”. Given that the majority websites fail to comply with the most basic web standards for accessibility in HTML, designing any system that assumes greater effort on the part of web designers seems doomed to failure. Takagi et al. (2002) recognise this problem and describe some technology developed to reduce the annotation time, but even with these improvements suggest that annotating a large site will take about seventeen hours. This is too large a number on the face of it, given the number of websites. However, the power-relationship of website usage and especially disproportionately-important service websites, may make some limited but high-cost manual effort worthwhile. For example, a solution dedicated to Yahoo! Mail would, while only addressing accessibility on one website, in fact make a great difference to many users.
When extra mark-up information is available, the content re-presentation will benefit. ‘Homer’ is a self-voicing web browser (Mihelic et al., 2002). It allows speech input and output (in Slovene). The publishers of Slovenian daily newspapers, such as Delo (Delo, 2004) provide current and archived newspaper content that is converted into HTML with special mark-up intended for use by Homer. This knowledge about the structure of the content and the extra annotation allows Homer to re-present the content in a hierarchical tree structure. This allows the user to use a small set of (spoken) commands to navigate the tree, such as “Skip”, “Open” and “Close”. The dedicated navigation system is facilitated by the consistent and well-structured HTML format.
If this extra structuring information cannot be provided, it may be possible to obtain it by analysis of the content. Ebina et al. (2000) describe a system based on performing comparisons between the current version of a webpage and the web page the last time it was visited. This was used to identify consistent sections – assumed to be intra-site navigation - and variable sections – assumed to be the content of interest. The user could bookmark sections on the page and thereby identify updated content. Changes in web pages over a nine-day period were studied for a search engine and a news site. The system proved most useful with sites which updated their content frequently (e.g. news sites) and infrequently changed their structure. Evaluation with users was positive: the advantages of the system were in identifying new content that might otherwise be missed and in allowing the user to go straight to the content section already identified. However, only two selected web pages were evaluated. The system would face greater challenges in handling highly-variable real-world web pages, and there is an overhead required in setting up the comparison system that would be ineffective if the user was browsing many different sites. The authors also propose that the system should compare unvisited pages on a given website against a template for the whole site to allow bookmarking to work on any (similar) page based on the identification of consistent page features.
One last solution for blind people is to use a web browser is not specifically designed for blind people but presents an accessible rendering to the screen reader, such as ‘Lynx’ (Lynx, 2004), ‘Links’ (Links, 2004) or the w3 browser in the ‘Emacspeak’ environment (Raman, 1996). These are text browsers designed for use in command-line interfaces (as opposed to GUIs). Their output is therefore linear text and they are designed for use with the keyboard, not the mouse, so are inherently accessible. This may be a good solution for very technical users who are accustomed to command-line interfaces.
4.2.5. Summary techniques
The summary functions of BrookesTalk (Zajicek et al., 1998) have already been noted. More generally a good summary of a web page would be of use to blind users, especially if it identifies the content of interest on a page. The web page TITLE element and a META element for summary information might appear to provide web designers with an opportunity to craft their own, but these are often misleading or lacking detail or even absent. Summaries might be generated for blind people for web pages, but this is challenging for an automated process. Berger and Mittal (2000) describe ‘Ocelot’, a system for summarising web pages, but note that it is difficult to summarise highly variable web pages in general. Summaries have been proposed as a solution for presenting complex information sources to blind people (e.g. Zajicek and Powell, 1997). The intention is to create a summary that is functionally equivalent to the quick summary that can be obtained by a sighted user on rapid examination of a visually-presented document. However, the problem is in creating automated summaries of meaningful and high quality. Buyukkokten et al. (2001) describe a process that is intermediate between summarising a whole web page and not summarising it at all, breaking down the page into sections and attempting to summarise each so the user can decide whether to explore this further. This is designed for users of PDAs, who have already been noted as having some similar problems to blind users. At present, however, summary techniques are still developmental. Search engines effectively perform summary functions in reverse, since they attempt to match key phrases – a user-provided summary – with the original web page. It may be more practical to rely on continued development of search engines to further improve their results and thus reduce the need for blind users to browse so many documents before finding web pages of interest.
Zellweger et al. (1998) describe an implementation of the idea of glosses, brief information about the target of a hypertext link that provides information to the user about whether they should expend the cognitive effort of following the link, risking the new node being of little interest and requiring back-tracking. These brief notes can be provided in a number of ways for sighted people, including pop-ups and marginal notes. The possible summaries or glosses they suggest here include a description of the destination, an excerpt, the relationship between source and destination, annotation on the source, meta-information such as author or creation date and link popularity or recommendations. Many of these would only be feasible in sighted presentation, where redundant information can be provided in the knowledge that it will not greatly detract from the user’s experience, but some simple information about the type of the destination might be of use. Navigating to a new page, examining its contents and coming back takes more effort for blind users, so if a gloss could provide information that saves them from having to follow links this would be of value. Zellweger et al. cite work indicating that this would be of benefit to sighted hypertext users, and it can be hoped that use of these glosses become more widespread. Until they do, however, there little benefit in providing support for them for blind users.
4.3. Web Access Tool Design
This section describes the development of a web browser for blind people, and how it addresses both accessibility and usability. The browser has been made freely available on the Internet, and supports a user group of hundreds of users: feedback on the browser from some of this group is presented in Section 4.4. First, a description of the strategy adopted in pursuing the design of the web browser, named WebbIE.
WebbIE does provide some support for partially-sighted users, such as text magnification, colour and appearance, and alteration of the display of visual rendering of web pages to suit the user. However, this thesis addresses the problem of blind people. It should be noted that partially-sighted users using screen magnification or very large font sizes have many of the access problems of screen-reader users, since they also have a restricted field of view and must approach a web page in a linear way. A magnifier user moving their field of view around a web page has similar problems to a blind user trying to move through a linear representation of the page.
4.3.1. Rationale
Web accessibility solutions are categorised Section 4.2. The import of these solutions for WebbIE can summarised as follows:
1. Screen-reader developers will continue to improve their presentation of web pages viewed in a standard browser, mainly Internet Explorer.
2. There will be a continued pressure on web page creators, the developers of web design tools, and companies and organisations with websites to comply with web accessibility standards. This is achieved through pressure on the websites (e.g. lobbying by individuals and organisations) and legislative action (e.g. Section 508 of the Workforce Investment Act in the United States (CITA, 2004) or the Disability Discrimination Act in the United Kingdom (RNIB, 2004c)).
3. Transcoding proxy servers will not be successful since they face too many technological problems and advanced techniques rely on cooperation from website designers that has been as yet not forthcoming.
4. There is still benefit in producing individual web browsers, such as WebFormator or IBM Home Page Reader. There are great benefits of a dedicated application used by even a small number of visually-impaired people if they can then take advantage of the web.
This reasoning supports the development of WebbIE, a standalone web browser for blind people, and its release to users.
As with the design of the diagram reader described in Chapter 3, there are many potential approaches to designing the WebbIE web browser. However, as this is a textual information source we are spared the problem of communicating spatial information. The spatial information can therefore be dispensed with. There is no need to consider 2D/3D audio or haptic interfaces to try to communicate it. While Section 4.1 described some dedicated web browsers that attempt to provide information about the actual visual presentation of web pages by visual web browsers (e.g. Asakawa et al. 2002), WebbIE is intended to ignore the majority of the spatial and visual formatting, since the process of communicating it is so lengthy and difficult. It might be argued that the spatial layout is vital to understanding the page. However, the counter-argument is that it is best represented in semantically structuring a text representation of the web page layout according to the structure it implies rather than attempting to communicate it directly. For example, the user might be told that “there is a navigation bar with ten links” rather than “there is an area in blue to the left of the screen that contains ten images all the same size and all links”. This contrasts with the approach taken with diagrams described in Chapter 3, where in spatial navigation spatial layout was used explicitly to structure the information source. First, it is important to note the very limited degree of spatial information provided in the diagram access tool (largely directional in a connected node, no area or shape information), and second, this difference is due to the different types of diagram, diagrammatic versus textual. The diagrammatic information source has information localised to points. The textual information source is composed essentially of blocks of text.
If the re-presentation of web pages does not to involve trying to present spatial information to the user then can it be handled within the re-presentation models of the standard browser? The lack of a caret, the limitations of what can be accomplished with browser-only re-presentation and the inaccessible nature of the browser canvas demanded a more powerful solution. Can a proxy solution be employed? This was rejected on the grounds that proxy servers cannot handle complex browser-server interactions (such as encrypted transmission used in commerce and some services) and they rely upon long-term and guaranteed support from the proxy host. A key driver in the development of WebbIE was the desire to produce a piece of software that had immediate and practical application for blind people. Making WebbIE a distributable, stand-alone application guarantees that it will work at least for that user until such time as something better becomes available.
Should WebbIE be a mediator operating in conjunction with Internet Explorer (such as WebFormator) or a standalone application (such as IBM’s Home Page Reader)? The close relationship between these two types of solution confuses the choice, and a real understanding of the relationship of the solution to Internet Explorer will be described later. A standalone application has greater flexibility and the ability to customise its behaviour without reference to the Internet Explorer instance in simultaneous use. The solution takes advantage of these factors and is best regarded as a standalone application.
Finally, should WebbIE be self-voicing, like IBM’s Home Page Reader, or present an accessible text-based interface that relies on the user’s screen-reader, like WebFormator? This is a similar choice to the one faced by the diagram access tool in Chapter 3, and the same decision was made: WebbIE should again rely on the user’s screen-reader, not self-voice.
Since WebbIE will be used with speech or Braille, not visually-presented text, it is vital that it is sparing in its presentation of extraneous text content. The principle of “Maximum information minimum text” (Blenkhorn and Evans, 2001 [21]) in screen-reader use mandates the restriction of text to that absolutely necessary for communicating the content effectively. Text that might be of benefit in a few limited situations but must be presented far more frequently than these situations arise must be rejected in favour of a restriction of the addition of text to the support of identified user tasks. For example, providing information on the appearance or location of sections of text – in bold, or “to the right of the screen” – may well be of use. It is used by sighted users to communicate better the emphasis and structure of the text. However, for the sighted user, this information is provided without any negative impact on reading the text (for sighted users without print impairments, in fact). For screen-reader users the information would have to be either provided by a non-speech sound throughout the reading of the section of text (which would have to be left to the screen reader), done through prosody (again, the responsibility of the screen reader) or noted in the text with more words. “I was very happy that day” might be “I was BOLD very END BOLD happy that day”. This is disruptive of the user’s main task, reading the text of the page and finding content of interest. It takes longer to read everything, the text is disjointed and confusing, and elements that are important – such as form elements – can be lost in the noise. Supplementary content must be carefully assessed as to whether its inclusion is “cost-effective” for the screen-reader user. This will influence what is presented to the user of the content of a web page.
It was therefore decided that WebbIE would be a screen-reader-neutral, standalone application. It would be a pragmatic and practical solution to the problems encountered by blind people, specifically screen-reader users, and be free and readily available to those who can benefit from it. This will illuminate some engineering design decisions that follow.
With this general approach established, the re-presentation model adopted can be described.
4.3.2. Model
The re-presentation model of WebbIE operates according to two general strategies. The first, the presentation model, describes how the user interacts with web page components. The second, the structure model, describes how web pages are reconstructed and amended to support the presentation model. Taken together, they describe the specific approach taken to web page re-presentation.
4.3.2.1. Presentation model
As a textual information source, the obvious presentation mechanism is a rendering of the web page in text, with a caret, because this is fully accessible to a screen-reader user. The need for a caret was described in Section 4.1.5. As a body of text, the web page representation would be no longer a two-dimensionally-structured visual rendering, but a temporally-accessed linear body of text. It could be accessed using the screen-reader techniques and shortcuts for reading bodies of text – read next paragraph, skip a line – that would be familiar to the user. The linear structure is simple and fits with the way screen readers are used. This linearisation therefore handles the basic problem of re-presentation of the textual content. The successful Opera browser for limited devices also linearises page views to fit them in the limited screen real estate, but it does not restructure the page (Opera, 2004c).
The most important functional feature is the hypertext link. Links are presented one link per line, with the link text on the same line. Figure 52 shows the ways that hypertext links can be presented to a sighted user, as text or an image, or as different parts of a larger image accessed by a mouse (a client-side image map). Figure 53 shows the WebbIE re-presentation of this content. A link begins on a new line and is clearly labelled with the word “LINK”. This is followed by the descriptive text for the link provided by the page. All of the different types of link are rendered in the same way, since they all do the same thing for the user and support the same tasks: leaving the current page (or moving to a different place on the current page – an internal link moves the caret to the internal link target). This is a simple re-presentation that does not provide unnecessary visual information (e.g. telling the user whether a link is a text link or an image link) and therefore supports screen-reader use. This has problems when WebbIE encounters links for which meaningful descriptive text is not provided. Figure 52 contains an image link lacking an ALT tag. In this case WebbIE cannot determine what the image might mean, so instead presents the filename (the last part of the URL) of the target of the link, as shown in Figure 53. This often has a meaningful name, such as “contact.htm” or “index.htm” which can help the user.

Figure 52: Various link types in a visual browser. Both the image links with and without “alt” attribute information appear the same to a sighted user, who is presented with the actual image. Both link to an HTML file called contact.htm. The client-side image map consists of three images linking to two different files. This produces the effect of two shapes, one irregular, for the sighted user, which the user can select from with the mouse.
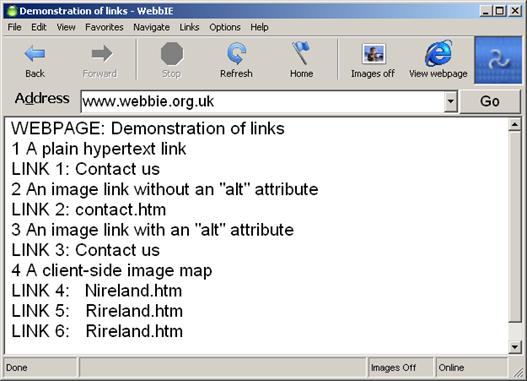
Figure 53: WebbIE displaying the link types shown in Figure 53. The image link without an “alt” attribute uses the name of the target file, which in this case is informative (“contact.htm”). The three different targets of the image map are all presented individually by WebbIE. If the designer had added “alt” attributes to these links it would have been used, but again the name of the target file has to be used.
Tables serve two purposes in HTML: they present tabular data and structure web pages for visual presentation. The former use might require a specialised presentation, such as allowing users to move on a cell-by-cell basis through the table and access column and row header information at any time. Systems have been built to attempt this (Oogane and Asakawa, 1998; Pontelli et al., 2002). However, it is believed that most pages containing tables are using them for presentation. Figure 54 demonstrates both uses (the navigation bar and content are separated by invisible table cells). Providing a complex table navigation function when tables add nothing of value to the content for a blind user is not worthwhile. The overhead of communicating table layout is almost certainly going to be an unnecessary distraction from the user’s real task of reading the actual content. Therefore, tables are simply linearised in WebbIE, the contents of each cell presented in sequence down the text display (or across if the user so wishes) as shown in Figure 55. Table captions, if they exist, are simply placed on a new line in the text display when they are encountered in the HTML code.
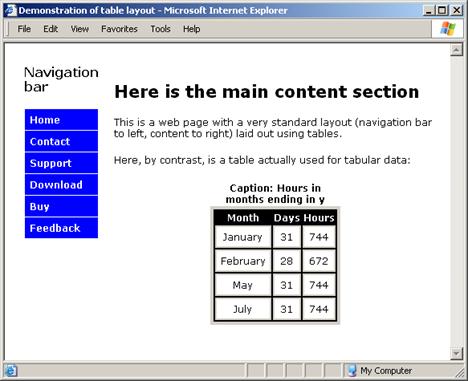
Figure 54: Use of tables for layout (separating the navigation bar on the left and the main content on the right) and for organising data into tables (the “Hours in months” table).
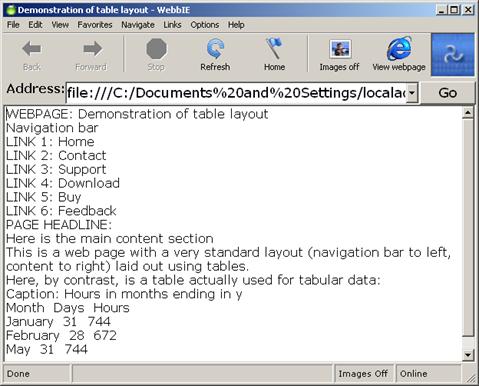
Figure 55: Demonstration of table layout.
Forms are for using the Web. Aside from online services and shopping, search engines require the use of forms to supply search terms. Search engines allow for different and enormously powerful navigation and content-finding strategies, so they must be supported. WebbIE presents the form components individually, as shown in Figure 57, which shows how WebbIE renders every HTML 4.01 form component. The component is described in text and accessed through pressing the Return key while the caret is on the component’s line. An action appropriate to the form component is taken: a checkbox becomes checked if unchecked and vice-versa, a submit button submits the form, and an input text box or area pops up a window allowing the user to enter the text content for the component. Again, everything is accessed line-by-line in the linear text document. The presentation model is exactly the same as for text and hypertext links.
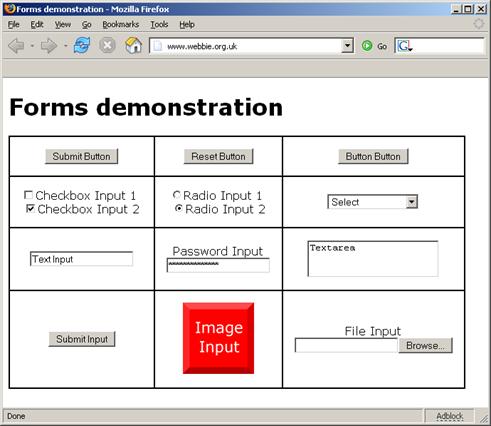
Figure 56: A visual web browser displays form elements. The BUTTON, INPUT, SELECT/OPTION and TEXTAREA elements are shown. An INPUT element with type of “hidden” is also present.
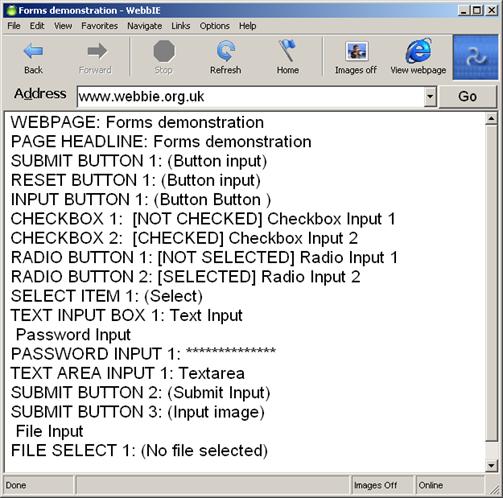
Figure 57: WebbIE showing the same HTML form elements as displayed in Figure 56.
Sites can employ frames to create separate areas of content on a rendered web page that can act entirely independently. Figure 58 shows this in action: the site is divided into three parts, a top main navigation bar, a secondary bar on the left, and the main content in the largest frame to the right. The scroll-bar on the main content frame indicates that this content can be scrolled: this will not affect the other frames. A link in any frame can affect the content of any other, so clicking on a link in one of the navigation bars can change the contents of the main frame. This separation of navigation and main content is accomplished not with frames but with tables on most sites, but the frame approach means the navigation bar need only be encoded once and can reference the main content as required. Any change to the navigation bar affects only one file. This was regarded as reducing maintenance (e.g. Albedo Systems, 2004). Frames have gone out of fashion (Johansson, 2004) because of various reasons, including misuse (overly-complex layouts resulted in many sighted users becoming confused with multiple frames and scroll-bars) and the increasing use of content management systems on larger sites (meaning that regenerating table content for every page is no longer a significant maintenance task). However, frames persist in use, and must be supported by a web browser – the page shown in Figure 58 will not allow the content of the site to be accessed without support for frames, despite the recommendation of web standards to the contrary (Chisholm et al., 1999, Guideline 6.5).
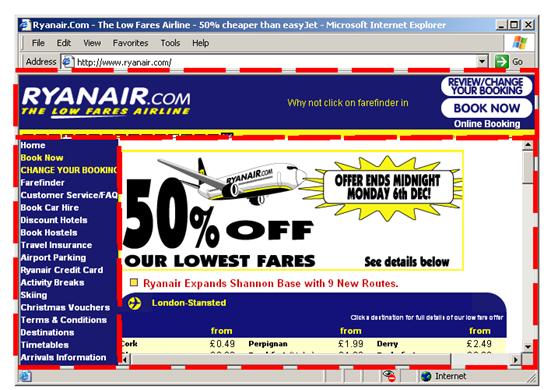
Figure 58: A web page employing frames for content layout. Broken red lines have been added to show the split of the content into three sections.
Frames therefore pose a similar layout problem to tables, and a consistent approach is taken to them both. Frames are linearised in the same way as the content of tables, without their existence or structure being explicitly presented to the user. Figure 59 shows the result. The framed web page employed in Figure 58 is laid out in text. The line highlighted in Figure 59 indicates the first item of the second frame, following on directly in the linear text display from the last item of the first frame. The contents of all the frames are laid out, frame by frame, just like the contents of a table used for visual layout. Each frame can then act independently as its own browser window, navigating to a new page or scrolling the field of view of the page within it, or even changing the contents of other frames or further dividing itself into new frames. In WebbIE this independence is supported but again not communicated directly to the user. Performing an action that changes the contents of a frame substitutes the new frame section for the old in the linear text display (e.g. clicking on a link in the navigation bar frame to change the contents of the main frame). This does not model the way a sighted user operates. He or she would move their attention from the navigation bar frame to the main frame as the content updated. However, the WebbIE approach is simple and maintains a consistent model for the user, who will be informed of the change with the normal page transition sound and can move his or her undisturbed caret to the appropriate section as required.
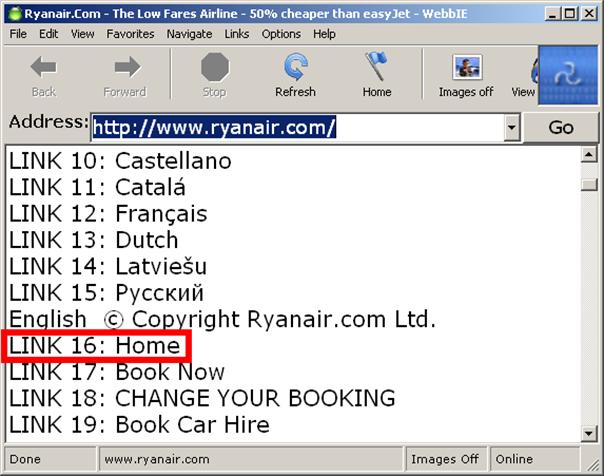
Figure 59: Frames in WebbIE. The highlighted link, “LINK 16: Home” is re-presented following directly on from the links in the first frame. As far as the user is concerned there is only one flat web page.
These examples all illustrate the important principle underpinning the text linearisation model: the resulting text output should contain as few features that get in the way of the user reading the content as are consistent with understanding the page content. This implicitly regards many presentational and structural features – tables, frames – as not being important enough in supplementing the user’s reading of the web page to warrant their inclusion. Again, the alternative would be to explicitly alert the user to these features. In such as system (that would probably be achieved by text descriptions of the feature, for example “TABLE START: FIRST ROW: FIRST CELL”), the extra cognitive and time cost in providing this information is not believed to be worth the benefit of gaining an understanding of these structural features. If structural mark-up was adhered to faithfully by more websites, such as the use of tables to present tabular data, then the situation might be different. As it stands, though, WebbIE assumes that this structural data is of effective use only to visual users and does not provide it to the blind user.
One item that is always provided is the TITLE of the web page on the first line (e.g. “Forms demonstration” in Figure 57) as this is often informative and the page otherwise often lacks a heading. Google similarly uses the TITLE as an important indicator of the page content (goRank, 2004).
4.3.2.2. Structural model
The structural model for a web page is not how the user is presented with the content, but how the web page content is structured and processed by WebbIE internally to support the presentation. Obtaining and parsing the content will be covered in a later section on engineering WebbIE: this section describes how the HTML code content is reconstructed into a form that supports the re-presentation process.
A web page consists of an HTML file, a marked-up text file. The process of parsing HTML results in a hierarchical tree structure. One such standard for this tree structure is provided by the W3C Document Object Model (DOM), or strictly models of increasing complexity (W3C , 2004c). This is an Application Programming Interface (API) that forms a platform- and language-neutral interface to the contents of a web page. A combination of methods and attributes allows scripts within the document and applications acting on the document to change content, style and structure and to trigger and capture built-in scripting functions and page events.
WebbIE works on this DOM, iterating through the contents and populating both an internal representation of the page and the linear text view as it goes. This is relatively lengthy process, so items such as links are identified and stored in simpler linear internal representations to preclude the necessity of iterating through the DOM multiple times for subsequent interactions with it. The processing of each node in the DOM depends on its type. For example, the contents of text nodes are output directly to the growing linear representation. A structural element, such as a table cell, is ignored, but the children of the node are iterated through for content. Figure 60 shows a concrete example of the visual rendering of three hypertext links (A elements). Figure 61 shows the HTML code behind the visual presentation. Figure 62 shows how the three nodes are represented in the DOM. This is the representation of the HTML content that WebbIE processes. As the page containing this code is processed the “P” node (“paragraph” type) is reached, causing WebbIE to start a new line in the linear text re-presentation. P nodes contain text and other children, so WebbIE iterates through the node’s three children in turn. The first link node is encountered. WebbIE stores the information about the link (such as its target, or href – in this case “contact.htm”). It needs to place the link at the start of a new line, but it has added a new line already (from the P node) so it knows not to add another. WebbIE adds “LINK” and the number of the link in the page to the linear text display. It now needs to find some descriptive text for the link. The children of the link node are checked. The first child is a text node: this corresponds to the descriptive text for the link, so its contents are used. WebbIE now moves on to the next node, the next sibling of the first child. This is the second link element. The same process is followed: this time, however, the link’s children do not include any text nodes, since the link is based on the use of an image. The image node is checked for “alt” attribute information, which is found, and this is used for the descriptive text. Finally, WebbIE processes the third A element, the final child. Again, this does not contain a text node, nor does the image node it contains have any “alt” information. Instead, WebbIE uses as descriptive text the value of the href attribute for the A node – the target of the link.
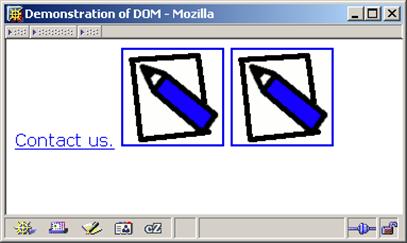
Figure 60: A visual rendering of three links
<p> <a href="contact.htm">Contact us.</a> <a href="contact.htm"> <img src="contact.gif" alt="Contact us"> </a> <a href="contact.htm"> <img src="contact.gif"> </a> </p>
Figure 61: The HTML code for the three links

Figure 62: The DOM result of parsing the same three links
Figure 63 shows the resulting linear text display in WebbIE. Also stored internally will be information about the three links, such as the target (“href”), used if a link is activated.
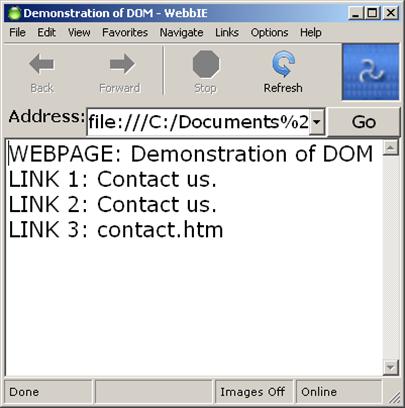
Figure 63: WebbIE displaying the three links
This brief example should serve to demonstrate how WebbIE processes a web page. It should be apparent that WebbIE is required to apply different specific rules to handling some of the 92 HTML 4.01 elements, and combined with up to 119 possible attributes for each element this would appear to require a great deal of processing. To take a simple example, Q nodes should be surrounded by quotation marks to indicate a quotation. If the “dir” attribute of the Q element has a value of “rtl”, the text contained in the Q node must also be displayed from right-to-left rather than left-to-right (e.g. as for Arabic rather than English text). More conditional rules must be applied to other elements, for example processing A links to find the descriptive text.
Two things assist in reducing the possible number of combinations to be addressed and implementing the application of these rules. The first is a set of non-W3C-DOM convenience functions that are available through an additional Microsoft-specific document object model, the Dynamic HTML Object Model, in WebbIE’s programming environment, Visual Basic (Microsoft, 2004d). For example, the “innerText” attribute available through this DOM is not part of the W3C DOM but returns the text node content of all the children of the current node. This is particularly useful when processing a link in the situation described above. Using this function it can be easily ascertained if the children of the link node will produce any descriptive text if processed or if the target of the link needs to be used. W3C DOM functions could be used to replace these Microsoft functions, but there is no reason to do so (since the application is not intended to be cross-platform) and they are efficient and useful. The second source of assistance is that many of the elements in HTML necessarily apply to visually formatting the content for sighted users, and can be ignored or reduced to the simple addition of a newline to the text display. For example, six elements (TABLE, TR, TD, THEAD, TROW, TBODY) are related solely to table layout. Since the great majority of tables are assumed to be used for visual formatting, not containing tabular data, the presentation model simply ignores the table layout. WebbIE cannot therefore claim support the entire HTML 4.01 gamut of elements and attributes. Appendix 1 supplies a list of elements and their support. As stated before, examination of these elements will reveal many instances where elements that could be argued to provide important semantic information about the text are ignored by WebbIE. For example, the use of the elements EM (for emphasis) and H2 to H6 headers are not communicated to the user. This may seem surprising, since their use can be assumed to convey information that would be of use to the user. Again, the reason that WebbIE chooses not to convey these elements is that the overhead of communicating the elements’ existence and import through text to screen-reader users is greater than the likely benefit.
4.3.3. Engineering
This section discusses the means by which the processes described in the previous section are carried out by WebbIE.
4.3.3.1. How to obtain web pages and the DOM
WebbIE is developed in Microsoft Visual Basic 6.0 (Microsoft, 2004e). This makes it platform-dependent, but ensures the user interface components used will all comply with the Microsoft Active Accessibility standards that support screen-readers (Microsoft, 2004f). Visual Basic allows developers to take advantage of internal Windows components in their own applications through a technology called ActiveX (Microsoft, 2004g). The key components here are the Microsoft Internet Controls, providing an ActiveX control called WebBrowser, and the Microsoft HTML Object Library. The former allows the use of a fully-functional instance of Internet Explorer in an application. The latter allows access to the W3C and DHTML DOMs.
Together these two components allow WebbIE to avoid having to perform any network functions (managing connectivity, obtaining data over the network, processing the data received into files), parsing (turning HTML code in text into the DOM, with all its elements and attributes correctly identified and any errors in the code resolved) and object model processes (iterating through the tree, finding particular nodes, querying nodes for information). This is a great saving of time and effort, and removes a potential source of coding errors. More importantly, since the Internet Controls are based on Internet Explorer, and Internet Explorer holds 94% of the browser market (OneStat, 2004), changes to the use of HTML on the Web will either be supported by Internet Explorer (in which case updating IE automatically updates WebbIE’s handling of the content) or not happen because Microsoft will not support them (and hence no-one will use them). Using these programming components ensures that WebbIE supports the latest HTML version in use and will continue to do so for the foreseeable future.
There are some caveats regarding the use of these components. One is that they require the installation of a modern version of Internet Explorer (5 or 6) on the client machine. This might exclude from operation older machines, but the posted minimum system requirements are low, at a Pentium processor and 32MB of RAM (Microsoft 2004h), and support is provided for older versions of Windows (e.g. Windows ’98 and Windows NT 4 are supported). These versions of IE are also generally recommended to users by the Windows Update service and this will assist their distribution.
Using the Microsoft Internet Explorer browser as a basis for an application also exposes users its security problems (for example, US-CERT 2004). Malicious websites can exploit weaknesses in the ActiveX system to install and run software on the user’s machine, often called “spyware” or “malware” (PC Review, 2004). Many of the security problems are related to the ability of Internet Explorer to run ActiveX controls (like WebBrowser) served by web pages: this allows some sites to provide advanced functionality, such as rich text editing facilities within Internet Explorer, but also poses a considerable security risk. While many of these sites are suppliers of visual pornography (Howes, 2004), and it is reasonable to assume that blind people are unlikely to visit these sites, the security risk remains.
An engineering problem for using the WebBrowser object is that pages that employ frames are not completely available through the DOM. Only the hosting frame page is available. Child frame pages – the actual content – are not. This necessitates separate processes to support loading a frame page, identifying the constituent frames, and using the WebBrowser control to fetch each frame individually. Since frames can nest, each of these frames may itself contain frames, requiring the process to be repeated to fetch these new frame documents. This is handled by WebbIE to produce the linear text output required, but it has an adverse effects. One is on support for scripting. The page using frames does not exist in Internet Explorer as it is presented in the text display, as a single functional entity. Instead it is a collection of separately-collected HTML documents and DOM entities, and scripts that assume access to the whole structure and operate accordingly will break. Another problem is with the normal Back function, which is ill-defined in frame pages. While this is a generally a problem for visual browsers as well (e.g. Nielsen 1996) the problem is compounded in WebbIE because of the difficulty in obtaining the path followed from the WebBrowser object that manages it. Using the Back function in frame pages in WebbIE generally quits the frame site for whatever was visited before it, no matter what navigation within it has occurred since it was entered.
Another potential problem with using the WebBrowser control is that the DOM only becomes available to WebbIE to examine when all the page content is available in Internet Explorer. This can mean a longer delay for the blind user than that for the sighted user, since IE generally starts to display page content as it arrives at the client machine, not when it all is ready. This is most notable in pages with images or other embedded content, where the text content of the page appears very quickly and the images and objects appear as and when they arrive. The page only becomes available to WebbIE when the embedded content has all arrived. A web browser that obtained and parsed the HTML itself could render the processed HTML to the user and save downloading the embedded content until required, or do this in the background as IE does. To ameliorate this problem to some degree, if the web page is taking a very long time and the user halts any further downloading, then what is available in the DOM will be processed and presented. This is usually the great majority, if not all of the web page content.
Problems arise if the WebBrowser object does not correctly parse and present the page content in the DOM for WebbIE to process. In fact, this has been encountered in only two instances. First, the website "http://www.pointlesswasteoftime.com/film/matrix50.html" has an IFRAME and SCRIPT that in combination mean that the DOM is never made available to WebbIE. Second, if a page nests LI elements within H1 elements, the list contents are repeated a number of times in the DOM. Both these are uncommon events, if they are not unique. This very limited set of problems suggests that the Microsoft components are very reliable.
Using the WebBrowser object raises some problems with non-HTML content that should be downloaded rather than executed by a helper application – in other words, non-HTML content transmitted by HTTP, rather than embedded web page content. Executable or compressed files are good examples. Internet Explorer does not open these file types, but prompts the user to save them to disk. This mechanism is not available in WebbIE because of the way the WebBrowser control interacts with Visual Basic, and it cannot be prompted to save their “contents” to disk unless the contents consist of a normal HTML file. Instead another Microsoft component, the Winsock control, is employed to handle executable and compressed (zip) files. This is a lower-level component that requires WebbIE to handle more lower-level network functions, such as determining the nature of the connection and handling incoming blocks of data, but is sufficiently high-level for supporting the limited function for which it is employed.
A final and interesting issue is support for non-Western languages. The historical development of computing and the Web has meant that English, and to a slightly lesser extent other Western European languages, are fully supported in operating systems, applications and information storage systems. Web browsers and the Web are no different. However, web pages can now contain content of any language encoded in any number of ways. The problem lies in knowing how the web browser should interpret the series of bytes it receives over the Internet: what character set or language is being encoded and how? Correct HTML pages define their contents clearly using the “lang” attribute. If this fails, the Web server sometimes provides encoding information in the HTML page delivered to the browser. However, some pages supply neither of these cues, so Internet Explorer makes assumptions about the page coding and presents the page and DOM appropriately. WebbIE primarily works with these Internet Explorer results, preferences for which can be amended by the user in Windows. However, the user may sometimes wish to override IE’s determination of the page encoding, so WebbIE allows a particular page encoding to be specified by the user and the web page content provided through the DOM is converted accordingly. Display of this content is another problem. Standard Visual Basic text controls cannot display all of the possible characters encoded by HTML. For Windows 2000 or XP machines, a set of non-Microsoft ActiveX components called Unitoolbox from Woodbury Associates allow converted characters to be represented correctly (Woodbury 2004). For Windows ’98 and Me machines, which do not support the Unicode character-encoding standard (Unicode 2004), the character representation chosen by IE is converted into a Windows-standard encoding for those character sets that are supported. Most major languages (European, Chinese, Arabic, Japanese, Korean, and some South Asian) are available. WebbIE therefore supports a wide range of languages. The user interface can also be internationalised, creating a language-specific non-English web browser.
4.3.3.2. Standard browser features
Web browsers since Mosaic have come with a number of user interface features that are now expected functions for users and have been incorporated into other applications such as operating system file managers. These include a back and forwards function, bookmarks, and history lists [22]. WebbIE provides these standard functions using, where possible, the same shortcut keys as Internet or Windows Explorer. More generally, IE and Windows applications have a general set of functions assumed to be available in most situations. WebbIE supports many of these.
Supported features and functions include:
· Back and Forward functions. Back is the most frequently used navigation feature after following hypertext links, so it is very important for users (Catledge and Pitkow 1995; Tauscher and Greenberg, 1997). Problems with WebbIE and frames are discussed above.
· The Stop function ceases further activity and presents what has been obtained so far. The usefulness of this in handling pages with a great deal of embedded content has already been described.
· Refresh allows pages to be reloaded. This is sometimes useful to display changes to the DOM caused by JavaScript activity but not reflected in the linear text display.
· Bookmarks (or “Favorites” (sic)). The Internet Explorer “Favorites”, if any, are used and can be added to and edited through the normal IE Bookmark interface, all accessed through the WebbIE interface.
· Access to the file system and printing through standard Windows Open, Save, Print and Save As… functions. Users can save a web page as HTML or in the linearised text view (although if they do so it loses its interactive function, such as the ability to activate links since it no longer is associated with the DOM and associated collections of components).
· Normal Windows editing functions, such as Copy, Paste and Find. These are very useful for blind people, who can move text between applications as necessary. Examples might involve copying text from a web page into an email to edit and send on to someone else. Blind people can be assumed to be used to working with these basic text functions so they permit familiar strategies and habits to be employed. [23]
· A web address (or local file) can be designated the Home page, and WebbIE will go straight to that page on loading. WebbIE uses the existing IE home page and allows the user to set a new WebbIE/IE home page.
· The ability to change between linear text views and the Internet Explorer rendering of the page at the press of a button. This may be of assistance, for example, in handling pages with scripting that cannot be supported through the linear text view, or accessing embedded content. The features of a web page that are likely to be the target of scripts – form elements and links – can all be accessed through the tab key if the Internet Explorer control is visible. A separate instance of normal Internet Explorer can also be launched if necessary.
· Users can work online or offline. If online, the WebBrowser object fetches requested web pages from the Internet. If offline, stored cached copies on the local machine are used. This is useful if, for example, the user is using a per-minute dial-up connection and does not want to be connected while viewing pages already visited. If the user is online with a dial-up modem connection when WebbIE is closed, the user is prompted to see if they wish to hang up the active connections. This supports per-minute users and replicates IE’s behaviour when using dial-up.
Part of the WebbIE rationale was that it be useful and practical to blind users. One way of implementing that is to recognise the functions outlined above are indispensable in modern web browsers and to ensure that these were made available in WebbIE.
4.3.3.3. Non-HTML content
Non-HTML content can take any form, but a general division into three common types is possible: inline images (e.g. photographs and graphics normally placed on the visual rendering of a web page), embedded inline interactive content (e.g. Flash, Java) and content that requires another application to display, within the browser or outside it (Microsoft Word and Adobe Acrobat files). Descriptions of these three types are given in detail in Section 4.1. There is one further class of non-HTML content of interest: audio (or video) streaming, which is handled very differently from the other types of non-HTML content.
WebbIE presents inline, embedded and other-application content in very different ways. Inline images (referenced using the IMG tag) are by default not presented at all. The user can toggle on and off their display. If displayed, they are simply provided as single-line items with the “alt” text of the image shown. Images which have “alt” text of a single space character (“ ”), an empty string (“”) or an asterix (“*”) are never shown since these “alt” labels can be used by designers to indicate images that are purely structural and presentational, for example featureless spacing images. The empty string is mandated by the W3C accessibility standards as indicating an irrelevant spacer image (Caldwell et al., 2004). The asterix was used to indicate spacer images by the popular JAWS screen-reader, leading to its use by some web pages. At one point its use was recommended by the RNIB (RNIB, 2004d). The use of a space may not be a mandated standard but is recommended in many usability discussions and reference documents from authoritative sources (e.g. WebAIM 2004) and so is supported in WebbIE. The situation is somewhat complicated by the fact that the DOM does not provide any way to differentiate between an empty string “alt” value and an image without any “alt” value – both return an empty string when queried. The HTML code for the IMG element could be queried to check for “alt=‘’ ” (i.e. the “alt” attribute exists but no content has been set) to determine the actual status of the “alt” tag. However, WebbIE does not in any case display images without “alt” tags even when image display is turned on, since it is unlikely that the filename of the image, which would be the only possible information about the image that could be provided, would be of any real use to the user. Line after line of “IMAGE: DSC00001.jpg” would not be helpful.
Embedded content, appearing within the rendered visual web page but run by an external application, cannot be placed within the linear text-only display. This includes Java applets (Sun, 2004b) and Macromedia Flash and Shockwave objects (Macromedia 2004b, 2004c). WebbIE provides the “alt” information for the object, if available, in the text display, but also allows the user to activate the object. This causes the object to be launched in a separate instance of Internet Explorer, scaled to the object size, and the focus of the application is passed to the object. If the object’s contents are accessible to the user’s screen-reader then the user can access and use it. The accessibility of these objects is, of course, another problem: as discussed in Section 4.1.4, many embedded objects pose considerable accessibility problems for screen-reader users. Flash and Java objects are largely inaccessible. Figure 64 demonstrates this process in action. The pop-up IE window contains the embedded content identified in the linear text display. If the embedded content had had an “alt” attribute value, that would have been used to label the activating link.
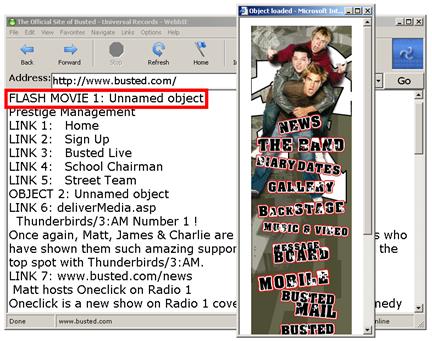
Figure 64: A Flash embedded object activated from the highlighted line in the WebbIE text display
Documents opened by an external application, such as Microsoft Word and Adobe Acrobat files, open within the Internet Explorer display just as though the user were using IE as a standard browser. The user viewing the text display is alerted to the file type and alerted to the need to change view to the IE display. If their screen-reader can access the content, they can work directly with the downloaded document. However, this solution is not really satisfactory: a better solution would be to maintain the linear text presentation model for these different document types and present them wholly in the same screen-reader-accessible text display as a normal HTML page. This is not a trivial process. The Internet Explorer control does not provide an API to allow WebbIE to access the non-HTML document, but the existing Winsock functionality built into WebbIE for saving executables would allow the document to be retrieved and saved as a local file. This could then be worked on directly. The problem is in processing the non-HTML document into a text-only representation. For Word documents, this can be accomplished relatively easily, so long as the user has Microsoft Office installed on their machine. If it is, Word can be operated in an analogous manner to the use of the Internet Controls and DOM already employed in WebbIE. A Word object model exists that permits access to the contents of a Word document in the same way as the W3C DOM allows access to the contents of an HTML document (Microsoft 2004h), and processing it to obtain the text content would be relatively trivial. However, not every user will have Microsoft Office installed on their machine, and without it they cannot access this API. OpenOffice, a free office suite, might be employed as an alternative since it provides a similar API (OpenOffice, 2004) and allows Word files to be accessed. This would, of course, require the user to install another large application. More to the point, Microsoft Word is generally very accessible to screen-readers, partly because it is so by nature (having a caret, consisting mainly of text) and partly because screen-reader manufacturers ensure that their products work well with the most popular word-processor in the market. By comparison, Adobe Acrobat is a more interesting problem. PDF is by nature a means for presenting documents in a paged format suitable for printing and visual display (Adobe, 2004a) and poses considerable problems for screen readers (RNIB, 2004e). No exposed API or DOM is available in Visual Basic for users unless they install the Adobe Acrobat software costing £927 (Adobe, 2004b). The free Adobe Reader does not provide the same interface. However, since the PDF file format is a published open standard, free software has been developed to work with PDF files. ‘Ghostscript’ (Ghostscript, 2004) and ‘PDFTOHTML’ (PDFTOHTML, 2004) are two such free sets of conversion tools available for download. A prototype of WebbIE was developed that used the PDFTOHTML application. It does not provide an ActiveX interface, but WebbIE can call the application through the operating system and open the resultant HTML file when conversion is complete. This allows Adobe PDF files to be opened and navigated in exactly the same way as web pages (allowing for the translation delay). However, while these free applications are available to download and use for individual users, their inclusion in another application requires that the containing application (i.e. WebbIE) complies with the licensing agreement of the free application. These are variations of the General Public Licence (GPL, 2004). The import in this case would be that the code for WebbIE would have to be released under the same licence and be made freely available for amending and distribution, which the developer is currently unwilling to do. An alternative would be to ask the user to install the helper applications separately and have WebbIE detect their presence or absence and adjust its function accordingly: this would be in compliance with the licensing requirements (the same approach could be taken with OpenOffice for Word files). However, the most useful application, PDFTOHTML, does not come with an installer, requiring the user to uncompress and correctly store the files and amend the system variables by hand. This is unsuitable for anyone but very technical users. Of course, under the GPL, the PDFTOHTML application can be taken and a user-friendly installer created: this may be a suitable future solution.
The final type of non-HTML content encountered by WebbIE is streamed audio (or video) content. An excellent example of this is the BBC website, which allows users to listen to real-time current radio broadcasts and a limited number of older programmes (e.g. BBC, 2004b). The content is played as and when it arrives through the network, a process called streaming. The transmission of content is generally fast enough to play the audio stream in real time to the user, so the user can listen to live radio broadcasts or to pre-recorded audio programmes without waiting for the whole audio file to download. Behind the scenes the browser uses another application, such as the free RealPlayer (Real, 2004) or Windows Media Player (Microsoft 2004j) to play the audio stream. The user controls it through the web page, which acts as the user interface to the media player (Figure 65). When the same situation arises in WebbIE, the Internet Control again handles it: IE launches the media player and the limited WebbIE scripting support enables the WebbIE version of the web page user interface to operate the media player. Figure 66 shows WebbIE demonstrating control of the Real media player through the WebbIE rendering of the BBC web page interface.
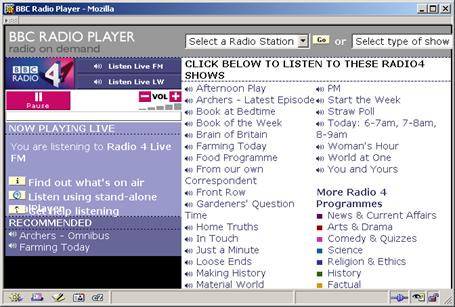
Figure 65: The BBC Radio player in action
Of course, this does presuppose that these media players are installed on the user’s machine already. Windows Media Players ships with modern versions of Windows, and is pushed to users in the automated Windows Update process. Other media players must be obtained and installed by the user from the relevant website.
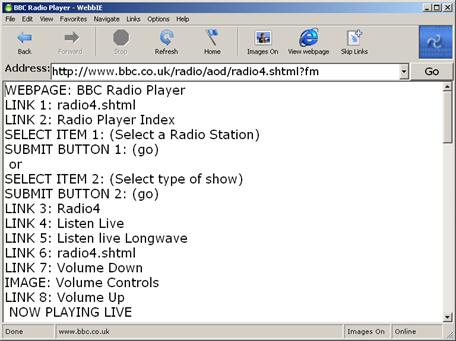
Figure 66: WebbIE playing BBC Radio 4
4.3.3.4. Assistive Technology features
The previous sections have discussed how WebbIE handles the re-presentation of the same web content that would be viewed by sighted people. However, there are a number of HTML features that are designed to support blind and visually-impaired people and not usually used by visual users, and a number of special WebbIE functions for access to web page content that are designed specifically for non-visual users. This section describes their operation.
Support for accessibility features in HTML
The HTML standard describes a number of accessibility features specifically designed to assist non-visual users of web pages. The employment of these features by web page creators is spasmodic at best, and the correct employment of these features even less common. Nonetheless, they do exist, and increasing numbers of web sites (often under legal and political pressure) are seeking to achieve the necessary usability accreditation by employing these features. Taking advantage of these features is therefore prudent to guarantee WebbIE remains as useful as possible on web pages increasingly using these features.
The “accesskey” attribute can be applied to form elements and hypertext links. It defines a single access key that can be used as a keyboard shortcut to the associated page element (i.e. by pressing the “Alt” key and the access key in combination). WebbIE supports the use of access keys for hypertext links. While there is no formal W3C standard for what access keys should be used for what link destinations (e.g. “use C for a link to the Contact page”), there are a number of competing but broadly similar standards, such as those produced by the UK Government for British state websites (e-Government 2004). The more widely a single standard is adopted, the more useful the standard will become, since a user will not need to be instructed in the particular shortcut keys for a web site but will be able to assume (correctly) that Alt and C goes to the contact page. WebbIE records any links with access keys as they are encountered while processing the DOM, and simply navigates to the target indicated when the access key combination is entered. WebbIE should support access keys for form elements as more web sites add access keys to forms as well as links and a standard emerges for their use (e.g. “s” for the submit button).
Images can have a “longdesc” attribute. This is supplementary to the normal “alt” attribute. It differs in that it is a link to a web page that provides an accessible resource that is more of an equivalent for the image rather than the “alt” attribute’s simple explanation of what it contains. The “longdesc” link is rendered by WebbIE as a simple link but labelled as an image description. This allows users to understand the context of the link in relation to the current document and know better whether to follow.
The LABEL element is used to associate text with form elements. Without such explicit labelling, it is easy for the text explaining the purpose of a form element to become disassociated from it. Visually-presented, it may be apparent that the text to the right of a text box indicates its purpose: in the linear presentation of text, this would mean that the informative text would come after the form element, not before. WebbIE identifies any LABEL elements in the page and when their form element is encountered during creation of the linear text view the LABEL content is added just before the form element.
Finally, one attribute that is not supported is “tabindex”. This is used to indicate to the browser the proper tab order of components (links and form elements) on the page. This would not suit the linear text model, since it would complicate the simple interface by adding a variable effect to the normal tab key action (which normally moves between the text view, Go button and the address bar) and by creating a unique non-linear route through the text.
WebbIE functions to support non-visual use
WebbIE provides some functions that supplement normal web browser functions with functions intended to address particular user needs and tasks for blind and visually-impaired users. This section describes them.
Google is the most popular search engine on the Web (SearchEngineWatch, 2004; JD Power, 2004). A simple shortcut key in WebbIE allows the user to enter a search phrase directly into a pop-up text box and the query results from Google are displayed in the main text view. It would be feasible, for the current Google layout, to identify the actual links in the result and present these in a dedicated search-results interface. There are two reasons for not doing so. One is that it would be necessary to build this new interface, providing all the information in a query returned from Google (title, summary, file type, web address, link to Google cache) and the user would be required to learn how to use it rather than remaining within the familiar consistent linear text presentation model. However, the benefits to the user of such a model might well outweigh the extra learning required, since it would be closely tailored to the user task of identifying and using the task results. The second reason, however, is more problematic: if Google changes its layout, there is no guarantee that the specific transformation performed on the page to present it in the new interface will work. Better to provide a more robust and future-proofed way to access Google searches. (It would be very helpful, of course, if Google marked up its results pages in a consistent and semantically meaningful manner: however, it would then be easy for sighted users to take advantage of this to undermine Google’s revenue model by removing advertisements from the page, so Google would be commercially unwise to do so). One interesting development is the Google API, an interface to the search engine that can be used from within an application like WebbIE and returns search results in a clearly-defined XML format (Google, 2004a). This would be ideal for powering a custom search result interface for blind users. There are two caveats to this. First, the API requires individual registration of each user, who can use the API themselves free of charge or build an application that uses the API and pay Google according to how many other people use the application. In this case, the WebbIE developers would have to pay Google for each copy of WebbIE distributed (or some similar licensing arrangement). Encouraging each user to register individually to avoid this is possible but has the legality of this would have to be confirmed. Second, the system is apparently still in development, and although usable now there is no indication of whether it will change on final release, or when this release will occur.
A related function addresses the navigation task of finding content within a web site. This uses the same linkage with Google to restrict searches for the desired terms to the current web site. The intention is to reduce the difficult navigation tasks involved in tracing information of interest within a page by allowing search tasks within the site, even where no search facility is provided by the web site itself, since searching is a key route to information finding for many users (Nielsen, 1997).
Users can bring up a list of all the links on the page, ordered by page or alphabetical order. This is a convenient way to access directly the possibilities offered by the page for the leaving of it, supporting the basic navigation tasks required in hypertext.
None of these functions addresses the problem commonly faced by blind people in attempting to perform the simple tasks of identifying whether the page is of interest and trying to read said content of interest. This is a problem of considering how to handle the normal visual layout of a web page. The next section outlines some attempts to address this fundamental problem.
4.3.4. Finding the content of interest
This final section on the design of WebbIE describes how WebbIE addresses a fundamental task related to web pages as textual information sources: identifying content of interest. The assumption is made here that the “content of interest” is a real phenomenon. There must be a single area of a web page that contains information that is of cardinal importance in determining if the page is of interest to the user and is subsequently read if this turns out to be the case. The thinking behind this model has been described in Section 4.1.
Communicating the content to the user should take place within the linear text model so as to naturally be a part of the browsing and reading process. It should be entirely automated: although the content of interest can be identified unambiguously only by examining the rendered page with the awareness of its visual appearance, we have rejected the concept of trying to present this actual layout to the blind user and leaving him or her to work out the content of interest, as described by Asakawa et al. (2002). The solution decided on for WebbIE is to allow the user to move the caret and hence the focus of interest of the screen-reader to the content with a few key presses (or preferably one key press). This is a practical approach because it involves only a minimal and entirely optional increase in the complexity of the interface.
A number of different approaches were implemented for WebbIE to allow it to identify the content of interest. The first, despite previous assertions that pages generally lack correct semantic mark-up, relies on the correct use of the H1 header element to indicate page structure and by inference the start of the content of interest. The W3C Web Accessibility Guidelines state: “3.5 Use header elements to convey document structure and use them according to specification. [Priority 2] For example, in HTML, use H2 to indicate a subsection of H1. Do not use headers for font effects.” (Chisholm et al., 1999). WebbIE identifies H1 elements in the text display, and the user can move the caret directly to the first of any H1 element with a single key press. This is a very simple feature and if web pages are designed in compliance with the W3C guideline, it would be very useful. However, since they very frequently are not, its usefulness in determining content is limited.
The next two functions are also activated by a key press, and move the caret to the content of interest. WebbIE can be set to attempt to identify two parts of the web page, the main content (content of interest) and any navigation bar. If this function is activated, the user have WebbIE move the caret directly to the identified part and the user can start reading there. However, two entirely different identification processes can be employed at the user’s discretion. The first attempts to identify the two parts of the page by iterating through the DOM and scoring each DIV and TABLE element according to a simple measure of the amount of text (for the main body) and the amount of link text (for the navigation bar) that each holds. The highest scoring element for each category is assumed to be the best representative of the category, and is marked as such in the text display. DIV and TABLE elements were used because they are used in layout and mark-up as containers for navigation and content sections. The second approach used to identify content and navigation parts relies not on analysis of the web page DOM but examination of the contents of the resulting linear text. That section corresponding to the largest length of non-link text, measured in number of lines, is assumed to be the content part. Conversely, that section corresponding to the largest length of link text, measured in number of lines, is assumed to be the navigation part. The two parts are labelled as before. These are both very simple algorithms. The key point of interest is that the first function operates on the page structure as defined in the HTML and the second on the page layout as rendered in the linear text view. The first makes assumptions on the correctness and semantics of the code, and the second on the pattern of content when laid out linearly, whatever their visual rendering in a standard browser. The first is a more satisfying approach, but the second may be more pragmatic and useful.
The final two, closely-related functions work on the same basic principle. The screen-reader user will be located on a particular line in the linear text view, indicated by the caret. The content of interest is likely to be a line of text (e.g. not link or form content). The two sections (navigation and content) are unlikely to be entirely different whatever our web page model: internal links will occur in the content and headings, labels and comments will be found in the navigation section. Identifying that a link is part of a paragraph of text, not a navigation feature in a side bar, is a difficult high-level function dependent on context. Given that, however, it is likely that long stretches of non-text lines are not indicative of the content section. With such an ill-defined situation, why not enable the user to move quickly over the non-text lines so they can identify for themselves the content of interest, if any? This leaves control of the caret with the user and makes the process of searching through a web page user-centred and part of the reading process. The task is facilitated but ultimately left to the user. In WebbIE, this approach has been implemented in two closely-related functions. The first, Skip Links, moves the cursor to the next non-link line in the text display (either up or down, as desired). The normal “next paragraph” shortcut combination, Control and a cursor key, is used, so it can be assumed to be natural screen-reader user behaviour when moving quickly through a document to find information of interest. Long stretches of non-text content, typically found at the top of web pages when navigation bars are rendered in the linear text representation, can therefore be skipped at a single key press. Form elements, such as search boxes, will also be skipped. There is a case for arguing that with search such an important part of user interaction with a website (Nielsen, 1997) it might be better not to skip form elements. However, it was decided that allowing the user to gain access to the content of interest as quickly as possible was more important. A second more drastic function, Crop Page, has a similar result in terms of user experience to Skip Links but takes a different approach. Activating it removes every non-text line from the page display, so moving the caret up or down a line will move exclusively through the text areas of the page only. Figure 67 (the web page before Crop Links) and Figure 68 (Crop Links function applied) demonstrates the function. This has the disadvantages of removing links from the middle of blocks of text where they may form part of the text, and removing links from where they may be operating as a title, as shown in Figure 68 where the news stories have lost their headlines (all links) and now follow immediately on from each other. The result can be a disjointed reading experience. The user can recover the removed content at any time, toggling the function on and off, so when the user has identified the content of interest or has identified one of these lacunae, the missing link can be recovered instantly. The user’s caret remains in the same position to prevent any confusion. This second function may allow users to move around the non-text content more rapidly. However, because it changes the page’s content – not order, but what is present – this may come at a cost of being disorienting the user.
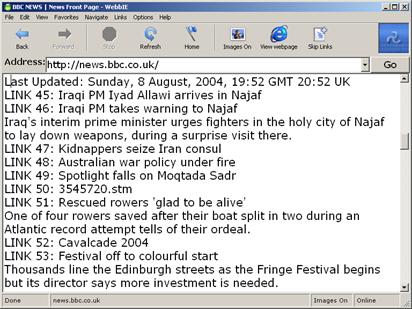
Figure 67: A web page, normal display
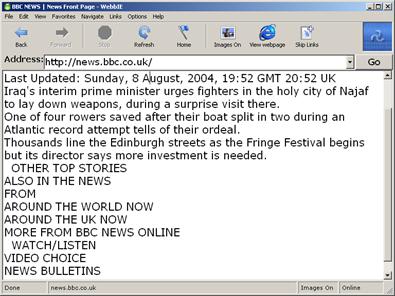
Figure 68: A web page with the Crop Link function activated
These functions were designed to address definite user needs and support reading tasks in this textual information source. The next section describes a study of Web pages for accessibility content that informed the WebbIE design and the brief results of an informal evaluation of WebbIE with blind users.
4.4. Web and WebbIE evaluation
WebbIE is freely-available for download both from the WebbIE site and other assistive technology sites, and is distributed by several companies (e.g. Choice Technology in the UK and Harpo Sp. in Poland). It is in current use with between 500 and 2,000 users, based on reports from the companies involved and known downloads. Feedback from end users and distributing companies have informed the process of updating and developing WebbIE, now in its third major release. As such, it is not a software artefact produced for research purposes only, but a real-world successful application for blind people: this has implications for evaluation. As an established product, basic usability can be assumed. The evaluation in this thesis will concentrate on demonstrating that WebbIE is a viable alternative to the existing assistive web access solutions and establishing how well it performs in terms of re-presenting real-world web pages.
This evaluation is presented in four sections: Section 4.4.1 describes an investigation into the accessibility of a set of web pages; Section 4.4.2 examines how well WebbIE could handle these pages compared to other assistive technology; Section 4.4.5 provides some responses from existing WebbIE users, and Section 4.4.4 describes further evaluation work to determine whether the visual content could be used to better identify the content of interest on a web page. This all allows some conclusions to be drawn on the success or otherwise of WebbIE and to plan future development in Section 4.4.8. Evaluation took place during and after development of the current version of WebbIE. Where the version or stage of development is of relevance, it is noted. Finally, a number of statements refer to significance and give ?2 values: in every case these were obtained by applying the ?2 test for significance of difference to contingency tables containing expected values (given the null hypothesis of “no difference”) and observed values (as experimentally determined and provided in the text) as described in Loveday (1961).
4.4.1. Web accessibility investigation
This investigation was intended to identify and investigate a set of web pages that could subsequently be used to test WebbIE’s re-presentation and inform design decisions about WebbIE’s operation (e.g. which accessibility features to support).
4.4.1.1. Selection of web pages to evaluate
Two subsets of web sites were identified to supply web pages to evaluate. The first was a randomly-selected set of websites to examine whether WebbIE works for the mass of web pages on the Web and the second a chosen set to represent popular, important and influential websites. (A full list is provided in Appendix 2).
Random web pages were obtained from the Yahoo! random page service, available online at http://random.yahoo.com/fast/ryl (Yahoo! 2004b). Requesting this URL returns a text file containing a random URL from the Yahoo! directory of selected web pages, numbering between one and two million pages (Sullivan, 2003). 114 pages were obtained and examined (this being a comparable number to the sample sizes in Disability Rights Commission, 2004, and SciVisum, 2004). This sample contains a range of web pages differing in content and style. As a sample of billions of web pages this may not be strictly representative: however, the range of the page designs permits meaningful conclusions to be drawn.
The set of selected web sites was determined by two means. The first was the examination of the lists of popular sites provided by the Alexa website (Alexa, 2004). Alexa produces software that records the sites visited by people who have installed it and hence provides the top sites for a number of categories. The second selection criterion was selection on the subjective grounds of importance and experience: for example, correspondence with blind people had indicated that the BBC Radio 4 and News websites were popular (www.bbc.co.uk/radio4 and news.bbc.co.uk), while newspaper sites such as the Guardian (www.guardian.co.uk) are a popular online destination. General categories were identified and selections made for the following, detailed in Appendix 2 and summarised in Table 3.
From these two sets of websites were selected a set of individual web pages (i.e. evaluation was limited to one or two web pages on the given web site). This was not always the page presented on first visiting the site. It is not the case that every web page in a web site is always laid out in the same way. Three classifications of web page were used, shown in Figure 69, an example from the random selection of web pages. The first class is a splash page, a page with one to three links whose sole purpose is to direct the user to the actual pages of content. It may have a Flash animation or large image. There is generally no content, although there may be a legal warning for an adult-content site, an option for which language to use, or requirements for Flash support to view the embedded content used in the site. An index page is the front page of the website proper. Often, this front page has the same layout and behaviour as the other pages on the website. In the case of an index page, however, it focuses on presenting the contents of the website, often laid out in a grid, rather that having any content in its own right. It will often have many links, possibly hundreds for a large website or portal. Navigating to any further page will bring the user to the content page. This is one that contains zero or more links and is rich in text or other content. Most pages in a website will be content pages. A website can dispense with splash and index pages, but always has at least one content page.
Table 3: Categories of sites selected.
Category | Contents | Examples | Number |
|---|---|---|---|
Search | Search engines | www.google.com | 5 |
Media | Newspapers, television, radio | www.guardian.co.uk www.bbc.co.uk | 24 |
Banking | Banks | www.barclays.co.uk | 5 |
Blind | Sites for blind people | www.rnib.org.uk | 16 |
Commerce | Shopping | www.amazon.co.uk | 6 |
Communication | Weblogs and communication | www.metafilter.com | 6 |
Computing | Software and programming | www.microsoft.com | 5 [24] |
Education | Educational establishments | www.man.ac.uk www.mgs.org | 3 |
Entertainment | Hobbies and pastimes | www.rhs.org.uk www.familysearch.org | 7 |
Government | State and utilities | www.nhs.uk www.bt.com | 12 |
Reference | Dictionaries and encyclopaedia | www.dictionary.com | 8 |
Travel | Information and services | www.nationalrail.co.uk | 8 |
TOTAL | 107 | ||
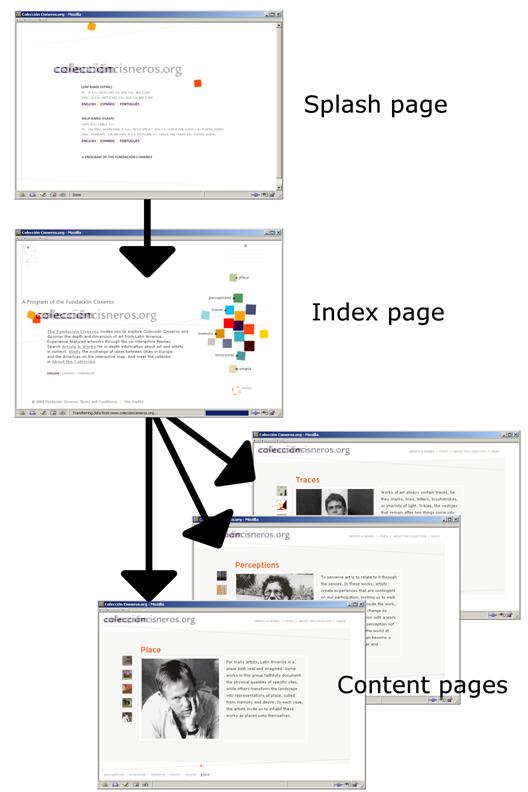
Figure 69: The relationship between splash, index and content pages on a website.
For sites with splash, index and content pages, one of each was evaluated. However, for the measurements taken, the index and content pages did not differ significantly (?2<95%) so either may be used from a website in the knowledge that it is typical of the website’s contents. In contrast splash pages are significantly different from index and content pages (?2>99.9%), so index and content pages cannot be substituted for them. Throughout the following, therefore, figures and measurements given do not include the splash pages of websites: in every case where the first web page presented on navigating to a website address is a splash page, an index or content page was used for evaluation. Splash pages do not represent the typical content of a website, and do not generally contain any information of value to a blind user. Where they bar access to the rest of the site this is noted: otherwise they are ignored, because while they are an impediment to use of a website they cannot count as a significant part of its information content.
4.4.1.2. Evaluating accessibility
The web pages were assessed for accessibility by the use of the automated Bobby tool (Watchfire Corporation, 2004), which assesses sites against the W3C Web Content Accessibility Guidelines (Chisholm et al., 1999). These guidelines are widely used by accessibility designers and classify pages as failing or achieving a rating on a rising scale of A, AA, or AAA. Because this tool is automated, it is effective at identifying tangible problems in the HTML code such as missing “alt” attributes on IMG elements, but cannot determine compliance with such high-level requirements as “Ensure that all information conveyed with color is also available without color.” (Checkpoint 2.1). Whether these requirements are met can only be assessed by human examination, so they are flagged to the person submitting the site for assessment as requiring manual attention. The issues of using automated tools like this to support accessible web page design have been discussed in Section 4.1.3. It can be assumed that, since the manual checks were not made, that some of the requirements will be failed and some of the ratings are subsequently too high. (In particular the requirement that pages are required to work without JavaScript. This will become apparent in evaluation of the sites with WebbIE presented in Section 4.4.3). The actual results, shown in Table 4, show that most sites fail even the simple automated tests. However, the selected sites score significantly higher than the random sites (?2>99.9%). This is not due to the influence of the sites for blind people in the selected sites: if their scores are removed, the selected sites still score more highly (?2>99.9%). The sites directed specifically at blind users do, however, score more highly than the rest of the selected sites (?2>99%).
Table 4: Web Accessibility (WCAG) scores from automated Bobby tool.
| WCAG A | WCAG AA | WCAG AAA | Fail |
Random sites | 17 (14.9%) | 1 (0.9%) | 0 (0.0%) | 96 (84.2%) |
Selected sites | 55 (51.4%) | 3 (2.8%) | 2 (1.9%) | 52 (48.6%) |
Totals | 67 (30.3%) | 4 (1.8%) | 2 (0.9%) | 148 (67.0%) |
According to the WCAG, then, the majority of web pages under examination are likely to suffer from some kind of accessibility problem. This will be discussed further when WebbIE is tested on the web pages.
4.4.1.3. Accessibility features
Section 4.1.3 described some HTML accessibility features and website design techniques to improve accessibility. The web pages were checked for the employment of these features. If an accessibility feature is widely employed, then WebbIE should support it: if it is not, WebbIE might support it but it is unlikely to be helpful to users, so it is should not be a high priority. Table 5 shows the results.
Table 5: The use of HTML accessibility features and the use of skip navigation
Feature | Selected sites | Random sites |
|---|---|---|
H1 header | 43.6% | 9.3% |
Any header | 61.8% | 16.1% |
Accesskey | 28.2% | 0.0% |
Table caption | 1.8% | 0.0% |
Table summary | 12.7% | 3.4% |
Form element labels | 47.3% | 0.8% |
Longdesc | 1.8% | 0.0% |
Skip navigation | 24.3% | 0.9% |
NOFRAME content for sites employing frames | 100% | 66.7% |
The selected and random pages are again significantly different (?2>99.9%) but perhaps the most important observation is the low rate of adoption of HTML accessibility features and the skip navigation function. The best rates are for the use of header elements, which, in theory, provide structure and can be useful to blind people and sighted people both, since most web pages have a visible title on the screen to orient and inform users. The great majority of pages, however, do not use the most important H1 header element, and a majority of the random sample of pages do not use headers at all.
The low rate of use for the HTML accessibility features is compounded by the fact that the use of a feature does not mean that it is used properly. For example, of the ten random sites that used the NOFRAME element, intended to provide an alternative to browsers that do not support frames, none provided a link to or the full content of the site, two provided only the name of the site and seven simply stated that the site requires a frame-capable browser.
These findings are in line with other studies described in Section 4.1.6, and suggest that reliance upon these accessibility features is ill-advised. However, the higher uptake amongst the selected sites is significant. If a very important and popular site, such as Hotmail (a free web-based email service) uses accessibility features, then the number of people who will benefit from being able to take advantage from them is far greater than the frequency of the accessibility features on the web generally. It might also be argued that the large corporations behind particularly popular sites (e.g. Microsoft for Hotmail) are more anxious and better able to implement these features because of political and legal pressure (e.g. AFB, 2004). WebbIE therefore supports these accessibility features despite the assumption that their use will be relatively rare.
Finally, Table 6 records the use of non-text content in the web pages that may pose problems for WebbIE. There is widespread use of HTML features beyond simple linear text-based HTML documents, and this will affect usability. The different sets of web pages are significantly different (?2>99.9%) but if it is assumed that the use of these non-text items is detrimental to blind people then the implication is that the selected sites will be more problematic than the random sites. It is no surprise that well-resourced major websites take advantage of the latest technology to provide a rich media experience for their clients and customers. The additional use of content which is more difficult to re-present may outweigh any better usability on the selected sites. For example, the large proportion of sites using tables similarly reflects more sophisticated layout techniques: these tables are overwhelmingly being used to lay out content visually on the rendered page rather than to present tabular data. One additional point is the smaller number of frames. Fashions in web page design are moving away from frames (e.g. Albedo Systems, 2004) and the selected sites reflect that. This should be of benefit to blind web users, reducing the frequency of the problems with frames encountered.
Table 6: Potential accessibility problems
Content | Selected sites | Random sites |
|---|---|---|
Object/Applet | 25.5% | 11.0% |
Table | 72.7% | 90.7% |
Image | 100% | 99.2% |
Frames | 1.8% | 28.0% |
JavaScript | 91.8% | 72.9% |
Forms | 86.4% | 33.1% |
4.4.2. Evaluating WebbIE against current alternatives
WebbIE needs to be evaluated for both whether it can perform its tasks (navigating to and using web pages) and whether it can perform them well. It is difficult to define objective criteria for success and failure that really reflect whether WebbIE will be of use to blind people. Usefulness will not be binary in general, but some point on a continuum depending on the web page, the task to be completed and the skill and determination of the user. For example, a page that fails to load is certainly useless, but a page that loads and displays correctly but has two hundred links may not be useful for a blind user simply because of the time required to read through it and find the content of interest. A good example of this is where hypertext links use images without “alt” information instead of text, forcing WebbIE to display the filename of the target page rather than any meaningful information. If the user is lucky with the filenames, or patient enough to explore, then the user will be able to make sense of the page and find a linked web page of interest. These are problems of usefulness, accessibility and usability. The problems of automated evaluation of these characteristics have already been described in Section 4.1.3. Non-automated systems involve experimentation either with end users or by evaluation by a sighted user against defined criteria (‘lab-based testing’).
4.4.2.1. End-user testing versus lab-based testing
Various methodologies are available. For this thesis the testing process involved lab-based comparisons of WebbIE with two access tools illustrating different approaches: the JAWS screen reader with Internet Explorer (the approach described in Section 4.2.1) and the IBM Home Page Reader self-voicing web browser (Section 4.2.4). The main alternative to lab-based tests would be some form of user evaluation: limited user response was obtained in the form of a questionnaire, results of which are presenting in Section 4.4.5, but the main focus of testing was not on end user work for a number of reasons. Firstly, this would tend to test the entire user experience rather than the strict areas of interest in this thesis: for example, since WebbIE presents a web page as a text field, the ability of the user to employ their screen reader to read text would be a chief factor in their evaluation of WebbIE. This could be ameliorated by good design, but isolating the specific characteristics of interest in laboratory conditions is simpler. Second, as already stated, the artefact is in successful real-world use, and has benefited from successive cycles of development and feedback, albeit informal: this is in contrast to the TeDUB development process, which was working on an unknown application type, so it is less necessary to establish that the artefact is capable of being employed by real end users. Third, and most significantly, it is impossible for blind test subjects to assess what is missing from a web page and generally very difficult for them to identify functionality that does not work properly. To be able to state that content is not accessible one must be able to identify that the content is present and what its purpose might be: this is clearly better suited to a sighted experimenter than to a blind end user.
The lab-based testing was split into two parts. The first used test HTML documents to test WebbIE’s basic abilities and performance. This consisted of testing WebbIE against test HTML derived from the HTML 4.01 specification (Raggett et al., 1999) and against a set of HTML documents designed to test speed of operation. The second stage of the evaluation involved comparing the performance of WebbIE against two established and wide-used assistive technology approaches to web accessibility.
4.4.2.2. Testing WebbIE against known HTML
The test HTML was not exhaustive, first because WebbIE does not implement all of HTML 4.01 [25], and second because the number of permutations of elements possible legally (and illegally but still supported by web browsers) is vast. Instead, a standards-compliant example of each supported HTML element was presented to WebbIE and tested. Likely variations were used: for example, the A element was tested with text content (e.g. “<a href=’home.htm’>Home</a>”) and with image content (e.g. “<a href=’home.htm’><img src=’home.gif’ alt=’Home’></a>”). This process identified bugs that were dealt with during development. Some yet remain, because of unaddressed permutations or failures of the browser to handle the standard examples. These include such items as incomplete implementation of the BASE element (it only works for FRAMESET elements, not for hypertext links in general) and bold or italic tags (or their equivalents) causing a space to be inserted if they are added in the middle of words (as is the case in the Google results page). However, none were judged to be of such severity that they affected the web browser to the extent that it should not be released to users. Some number of flaws in software artefacts is normal, and does not prevent their use.
A more formal set of tests is available from the W3C, the HTML4 Test Suite (Bobroskie and Çelik, 2002) for web browsers trying to implement HTML 4.01. While incomplete, these provide detailed testing for some special situations, for example testing whether the web browser correctly ignores unique IDs that start with a number. The results are shown in Figure 70. Of 87 tests, WebbIE passed 58 (68%) outright (either it behaved correctly or the test was inapplicable, such as testing for text colour selection by a style sheet). Of the 25 (32%) fails, the largest proportion of 11 (13%) was related to the inability of WebbIE to handle scripting events arising from mouse activity, such as the onmousedown and onmouseup events. The other failures were as follows:
· Frames were a problem because of the way that WebbIE hides their existence from the user. A page that has three frames will be presented to the user in WebbIE as one continuous page. The tests (and the HTML specification) assume instead that the user will be informed of the frames and given some way to access them directly. In three cases the frame test was failed because WebbIE or IE failed to handle the page correctly.
· WebbIE also fails to handle OBJECT elements as generic containers for embedded content, assuming that IMG and IFRAME will be used for images and HTML and OBJECT will be used entirely for Java or Flash content. The test suite, however, tests for the use of OBJECT to host content, which WebbIE failed to re-present correctly. The low incidence of OBJECT usage other than for Java or Flash, for example in the brief examination of web pages performed in Section 4.4.1.3 where all the OBJECT instances were Flash animations, suggests this is not a great concern.
· WebbIE does not support the “rowspan” or “colspan” attributes, used to control layout in tables, since it again simply linearises them, and this caused the failure of two more tests.
· WebbIE re-presents content in plain text, leaving prosody to the user’s screen reader, and so the EM and STRONG elements are not recorded in WebbIE’s re-presentation.
· Finally, three tests identified one problem each. One was with a submit button, which WebbIE failed to display for unknown reasons. The second concerned the execution of script files directly from a URL: rather than executing the script WebbIE prompts to open or save the file. The file can be opened and then executes successfully. The third was the fact that tab (and shift-tab) in WebbIE moves the caret around only the links on the page, not around form elements. This is a deliberate omission, intended to provide some alternative way of navigating through the page contents to the crop-page function, but if it is a required or expected standard this position will have to be re-thought.
Figure 70: Results of testing WebbIE with the W3C HTML test suite.
4.4.3. WebbIE evaluation against real websites and comparison with JAWS and Home Page Reader
WebbIE’s ability to re-present web pages in an accessible format was compared to two existing assistive technology solutions: the JAWS screen reader from Freedom Scientific (2004) and the self-voicing web browser Home Page Reader from IBM (2004a). These are widely-used and successful applications and can be regarded as an appropriate standard for access to the web for blind people. The three applications represent variations of the approaches described in Section 4.2, specifically:
· JAWS is a screen reader that enables users to use a conventional web browser such as Internet Explorer (Section 4.2.1)
· WebbIE is a standalone web browser that relies on the user’s screen reader to read the accessible text re-presentation of the web page (Section 4.2.4).
· Home Page Reader is a standalone web browser that self-voices the web page (Section 4.2.4)
All three are programs that are intended to provide independent access to any web page: other approaches described in Section 4.2 (transcoding proxy servers and existing HTML accessibility features) are not comparable alternatives to WebbIE and have significant problems outlined in Section 4.2, meaning they are not generally employed by blind users.
Each application was tested against the sets of real websites described in 4.4.1.1. The test criteria were employed by a sighted experimenter to permit the comparison of the web page as used by a sighted person with the re-presentation of the web page by each of the assistive technology programs. The sighted experimenter examined each website in the de facto standard web browser, Microsoft Internet Explorer, then in each of the assistive technology programs, assessing the web page’s representation against the following criteria:
1. The page loads and displays the content of interest (Section 4.1.1), identified by sighted examination of the visually-rendered web page in Internet Explorer.
2. From the page it is possible to navigate to other pages on the same site, which must also load and display correctly. The other pages were again chosen by sighted examination of the rendered web page, and were intended to be typical of other pages in the site or represent a likely route through the site. For example, for a commerce site the directory of goods on sale should be explored.
3. Forms on the page should work, or have another alternative (e.g. if a “jump-to” form does not work, correctly-presented menu items allow the user to access all the jumped-to destinations anyway).
While it is standard for usability studies to employ small numbers of testers, a single experimenter would not qualify as an end-user study. While the results are still of value because they address objective rather than subjective criteria (e.g. “can any user get to the content” rather than “how easy did a particular find it to get to the content”) and are therefore able to provide information on how each accessibility solution fared in the basic requirement of providing access to the content, this is a potential criticism of the study’s results, and appropriate caution will be employed in drawing conclusions from it.
The results are shown in the following tables. Table 7 shows the results across each program. Table 8 breaks down the selected sites that failed the criteria above and describe how and where possible why each one failed. Table 9 and Table 10 do the same for the random sites: Table 9 contains a breakdown while Table 10 contains sites that failed in all the applications because the content was by its nature inaccessible or the site was otherwise unusable.
Table 7: Number (%) of sites successfully re-presented for a blind user.
| WebbIE | JAWS/IE | Home Page Reader |
Selected sites (107) | 101 (94.4%) | 105 (98.1%) | 105 (98.1%) |
Random sites (118) | 104 (91.2%) | 107 (93.9%) | 106 (93.0%) |
All sites (225) | 205 (92.8%) | 212 (95.9%) | 211 (95.5%) |
Table 8: Selected sites unsuccessfully re-presented.
Program | Website | Explanation |
|---|---|---|
WebbIE | www.easyjet.com | JavaScript-enabled link from splash screen does not work in WebbIE, cannot enter site. |
mail.yahoo.co.uk
| Frames used to display/write emails do not display. | |
babelfish.altavista.com | Translated webpages are in frames, WebbIE fails to re-present content. | |
www.familysearch.org
| Page fails to load completely due to failure to re-present content in frames. | |
windowsupdate.microsoft.com
| Page fails to load and hangs WebbIE. | |
www.friendsreunited.co.uk
| Page fails to load. | |
JAWS | access.adobe.com | Form submit button does not appear in page reading. |
babelfish.altavista.com | JAWS correctly uses tab order specified in web page, but this is wrong and makes the form impossible to use correctly. | |
Home Page Reader | access.adobe.com | Input text field for submission form cannot be reached in Home Page Reader. |
www.ebay.co.uk | Fails to load page. |
Table 9: Random sites unsuccessfully re-presented.
Program | Website | Explanation |
|---|---|---|
WebbIE | www.intervalve.nl/ | Fails to provide all of content due to frames. |
vieclam.tripod.com | Fails to provide all of content due to frames. | |
www.romacon.nl | Fails to provide all of content due to frames. | |
www.millionauto.com | Fails to provide all of content due to frames. | |
www.laboriqua.com/ | Fails to provide all of content due to frames. | |
Home Page Reader | vieclam.tripod.com | Fails to load. |
Table 10: Sites with inaccessible content.
Website | Explanation |
|---|---|
www.owmnahar.com/owm/ | Flash-powered site. |
www.sumos.com.my | Flash-powered site. |
www.kargah.com | Image site without alt or longdesc attributes. |
www.millionauto.com | Site using images instead of text (i.e. presenting graphic files displaying text) without alt or longdesc attributes. |
www.trainbrain.com | Site content consists of real-time visual displays of trains in a railway network displayed through Java applets. JAWS successfully allows access to the controls in the applets but the displayed information is still inaccessible. |
www.laboriqua.com | Played loud, incessant audio when loaded, making it very difficult to use any synthesised speech with the site. A Braille user would be able to use it, (e.g. potentially a JAWS or WebbIE user) but this was classified as a fail for all three programs. |
www.genesisconsult.com | A JavaScript-powered mouse-based navigation menu system could not be rendered by any of the applications. |
The results for all three applications are good, with the great majority of websites in both categories fulfilling the accessibility criteria for every application. Home Page Reader and JAWS differed by only one site: WebbIE’s problems with frames, most apparent in the results for random sites in Table 9, explain its different results. These problems are almost certain to result in WebbIE failing on more sites that the other two applications, but WebbIE’s overall score of 92.8% of sites being accessible compared to 95.5-95.9% for the other applications is quite acceptable (and not statistically significant by Χ2 test on the values in Table 7, a value of 2.59 with 2 degrees of freedom.)
Although these headline figures are good, many of the sites that fulfilled the accessibility criteria suffered from problems even where the programs were judged to have successfully re-presented their content. Forms were often made more confusing by the reliance on visual formatting to make sense of labels and form elements, resulting in labels displayed below or not adjacent to their relevant form element (e.g. www.lastminute.com). The use of “alt” attribute values on images was infrequent but this was greatly ameliorated by the practice employed in all three applications of providing the filename of the target page, which in a majority of cases produced a meaningful link name.
The failure rate for the random sites was not significantly different from that of the selected sites for any of the programs. This is despite the fact that the selected sites are created by organisations with legal or public commitments to accessibility and employ professional web designers.
WebbIE successfully re-presented the content of every one of the sixteen websites in the selected group that cater to visually-impaired people: Home Page Reader and JAWS both failed on the Adobe site (access.adobe.com) as described in Table 8. However, the applications were not significantly better at re-presenting sites in this sub-group than other selected sites. This may be an artefact of the way that success was judged: sites that were less accessible than the sites for blind people – missing some “alt” attribute values, or using some JavaScript – were judged as being accessible, where more detailed usability analysis of the sites with blind people might show some real differences.
Finally, the automated WCAG score for a site was not a statistically-significant indicator of successful re-presentation of its contents by one of the three programs (at a Χ2–significance level of 99.5%). This reflects a lack of rigour in defining success or failure: some pages that passed will have usability and accessibility problems. However, the success of the three programs in re-presenting 136 of the 148 sites that failed the formal WCAG guidelines indicates that compliance with the guidelines, while suggestive of support for blind people, is not necessary for blind people to be able to access and use the web page. It does not appear, then, that the ability of web browsers to re-present content successfully is determined by WCAG compliance as determined by this set of automated tools. If it is assumed that web pages that can be re-presented and accessed by blind people are in some way usable, but that the ability to access the contents of a web page is not necessarily indicative of the ability to use it successfully – because of the complexity of the layout, or the number of links, for example – then the statement can be made that usability is different from accessibility as measured by strict guidelines.
The conclusion from this testing is that WebbIE performance is comparable to those of the market-leading assistive technology products, JAWS and Home Page Reader. In the context of its existing use, this finding is a positive statement of success that WebbIE able to re-present web pages to blind people. Section 4.4.8 places this in context of the other evaluation findings.
4.4.4. Conclusions for WebbIE’s implementation
Conclusions can be drawn from these results for WebbIE’s implementation. Support for frames was the most significant accessibility problem: this is a purely technical matter and can be rectified. The other significant problem encountered was inaccessible content, namely images and Flash: this was a problem across all three programs and is not easily solvable:
· Images might be transferred to some image analysis function, which tries to extract text, but this is likely to be error-prone and possibly slow. The better solution is to continue to press for good web design practice and the adding of “alt” information by web designers: while this places the solution in the hands of the designers who have failed to deliver so far, changes in behaviour must be trusted to improve the situation.
· Flash is more problematic: the simple “alt” attribute does not provide the same content as the interactive Flash interface, and designers providing a fully-featured HTML equivalent through the LONGDESC attribute seems a long way off. Presenting the inaccessible content consistently to the user’s screen reader is probably the best option, since it can be assumed that the screen reader will have been developed and optimised to allow access to the embedded content. However, it might be possible for relatively static Flash content – such as that directly replacing simple HTML – to be analysed and re-presented in the same way as WebbIE handles HTML. No DOM is provided for Flash as is available for HTML: the Microsoft Active Accessibility interface might be queried instead to allow the content to be obtained and presented. While the user’s screen reader might be expected to do that anyway the Flash may not be easily presentable as a standalone instance outside the web page to the user – WebbIE fails to present the embedded content on occasion because it is designed to be presented within the containing HTML page – and bringing the re-presentation into WebbIE allows the user to be insulated from the different user interface by re-presentation in the familiar linear text display.
· Java applets can extend to fully-featured applications and include security features to prevent access by external applications (REF), Similar arguments apply as for Flash: presenting the inaccessible content to the user’s screen reader is perhaps the best solution.
To provide some indication of the performance of WebbIE for some of its real-world users, it was evaluated by some blind people. Their responses comprise the next section.
4.4.5. User evaluation
WebbIE was evaluated with nine users by means of a questionnaire. The users ranged in experience and levels of visual impairment, and the sample size was small, so the data acquired is anecdotal but has the benefit of being from actual users. The users were all associated with a company that distributes WebbIE and performs training, so the results reflect some common background of training and preference.
The users were all screen reader users. The six users that had used the web before used IE in conjunction with their screen reader, although their level of success varied: after using of WebbIE three intended to use it.
The users cited a variety of favourite sites and most users browsed for new pages of interest. This suggests that able blind people can and do successfully overcome browsing problems to an extent that allows them to explore and use unknown sites, although all expressed some confusion over or ignorance of non-HTML embedded content. This is to be expected, since non-HTML content has accessibility problems both in WebbIE and generally.
All the users that expressed a preference (seven of nine) preferred Google as a search engine (www.google.com). Google use by users supports the inclusion of the dedicated WebbIE function. However, WebbIE does not at present perform any special processing on the result of its built-in Google search function, for example to prioritise the search results over the page navigation content.
Other popular sites included the BBC Radio sites to obtain radio program recordings and banking and grocery shopping sites. These commercial sites permit visually-impaired people access to services that usually require either customised information (e.g. bank statements in Braille) or intervention by a sighted person (e.g. to shop in a supermarket). Using a web site puts blind people on a more equal footing and allows providers to make their services more accessible at relatively little expense.
Aside from specific issues with the WebbIE interface general complaints were made about the many links often encountered at the top of a web page before the content of interest. These links are typically navigation bars, very useful for sighted people but are a distraction for blind people. As a consequence the WebbIE skip links function was very popular, although the function is considered very important by the distributing company and the expressions of support for its use may reflect that. This is reasonable support for the position that the task in a web page, a textual information source, is first and foremost identifying and reading the content, and supporting that task is important for web usability.
The main benefits of WebbIE were perceived to be the ability to cut and paste text from the simple text interface, allowing users to prepare content in other formats, and the handling of forms through a simple text interface. Users did not report any general problems with accessibility to websites, but as one user reported if an inaccessible site is encountered “there is lots of choice so I leave them alone”, so this may reflect why the sites that were singled out as being inaccessible were service providers where the user has a strong reason to wish to gain access to that service and not another generic one, for example financial or supermarket sites.
This user evaluation suggests that support for complex, service-providing pages is important – mandating better support for JavaScript – and the identification and communication of the content of interest is a vital part of the usability of web pages. This latter point is addressed in the final evaluations performed.
4.4.6. Access to service websites
The user evaluations confirmed that users want access to service websites, such as shopping or banking. Many of the selected sites deliver such services, so closer examination of a few is of interest:
1. Web-based email. The Yahoo! email service worked with WebbIE allowing the user to send, receive and read emails through the standard WebbIE interface (mail.yahoo.com). Hotmail (www.hotmail.com) however failed because of the extensive use of JavaScript.
2. Banking: Barclays Personal Banking (www.personal.barclays.co.uk) allowed the user to log in, see account details and make a payment. Nationwide personal banking (www.nationwide.co.uk) did not because of JavaScript-powered log-in security.
3. Shopping: Amazon (www.amazon.co.uk) did not allow the user to progress past the shopping basket page to the payment page, for no discernable reason. The standard Tesco groceries site (www.tesco.com) did not work in WebbIE because of its use of frames: the accessible Tesco website (www.tesco.com/access) did not allow a WebbIE user to sign up for the home delivery service because the form for user details did not identify its fields correctly (so the user would have to guess where to put a crucial identification number). The site used the TITLE attribute of the INPUT element to indicate its contents rather than a LABEL element as required in the HTML specification, and since the TITLE attribute is generally displayed as a pop-up tool-tip for visual users WebbIE does not display them. This might be ameliorated by displaying TITLE attribute content on links or form elements: this might add more useful information to a website, but at the cost of further confusing and adding to the text display.
4. Content creation: The weblog service Blogger (www.blogger.com) allowed the user to sign up to a new account, but not to post. It uses an embedded ActiveX control instead of a text input box, permitting sighted users to create richer content but inaccessible to WebbIE. The co-operative online encyclopaedia Wikipedia (en.wikipedia.org) allowed the user to create and edit articles through WebbIE.
5. Electronic Government. The UK Inland Revenue website (www.inlandrevenue.gov.uk) did not allow the user to apply for the Tax Credit scheme because one page in the multi-page submission process uses an inaccessible JavaScript-created user interface feature to handle input.
6. Media. The BBC Radio Listen Again service worked in WebbIE, launching Real Player and allowing the user to hear streamed radio programmes (www.bbc.co.uk/radio4)
These are mixed results for the service websites. However, as already noted in the user evaluation, the ability to take advantage of at least one of each service type through WebbIE would be a great boon for screen-reader users. Better and more specific WebbIE support appears to be required to support these services, if it is assumed that movement by the service providers to support blind users is unlikely, because the service-providing web pages are complex and difficult to manage. The small number of popular service sites may make a site-specific solution feasible where WebbIE’s general approach has failed. Section 4.4.8 describes potential work to address these problems.
4.4.7. Results of trying to identify content of interest
The last evaluation addresses the problem of finding the content of interest for a web page. As discussed above, this is a key part of information-foraging.
WebbIE provides two mechanisms for identifying the content of interest: allowing the user to move to the headline on the page, if any, and the skip links function. In fact, only 46.4% of the selected sites and 9.3% of the random sites used the correct H1 element to indicate the page headline. Support for the W3C-recommended (but neither mandated nor specified) practice of having a link at the top of the page directly the main content was provided by 24.3% of the selected sites but only 0.9% of the random sites so this cannot be relied upon either.
The WebbIE skip links function, described in REF, addresses this problem and was tested to provide a rough idea of its efficacy [26]. A sub-sample of 31 of the selected sites (selected at random, at least two in each category) was examined. This sub-sample indicated that the content of interest started on average on the 52nd line, requiring a screen-reader user to move through all the previous lines before finding the content of interest. At half a second a line to move and listen to the screen reader output, this makes 26 seconds of patient movement of the cursor before the page content is accessed. This provides some perspective to WebbIE’s performance: WebbIE will load complex pages in much less time than the user takes to identify the content of interest. The use of the crop links or skip links function placed the page content on the 10th line, a considerable improvement of 69% in the number of irrelevant lines. (The crop links function, removing non-text lines, and the employment of the skip lines function instead of one-line cursor down, have the same effect on the number of lines that must be navigated before the content is reached.) This is a considerable improvement on the face of it. However, it is not possible to generalise to an average saving of time for several reasons. The content of interest may actually be a link or other element skipped. The Google search results page lists potential websites as hypertext links, so the function will skip past it. Other pages contain only links, especially front pages of sites, so it is impossible to skip to the main content: Figure 71 shows such a page without a clearly defined content of interest.
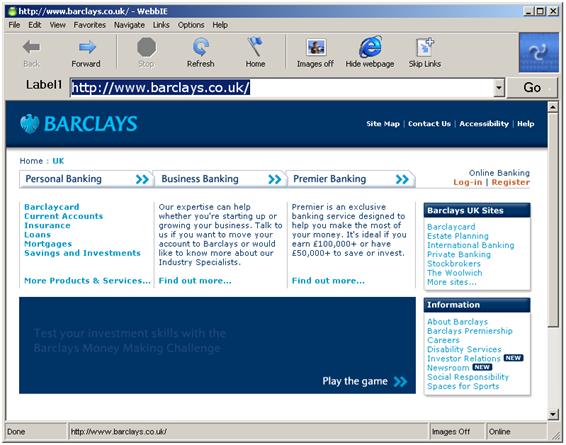
Figure 71: WebbIE showing a page with no effective content of interest. The service web page allows users to choose from various functions. The large blue area below and to the left is a Flash animation.
On other pages (e.g. the front page of Google) the content of interest is a form element such as a text box. This particular instance of the problem might be resolved by providing a “skip to form” function. However, the figures do support the suggestion that the function is genuinely useful, and are in line with positive comments from users. As with the disclaimer on usability, this assumes that the user is able to make sense of the page with and without the non-text sections: for example, it may be harder to find the content section in pages that make titles hypertext links.
WebbIE’s mechanisms for identifying content are therefore relatively useful, but limited. It might be possible to identify content of interest by examining not the HTML code of a web page but the actual result of rendering on the canvas of a visual browser. This means approaching the examination of a web page from the point of view of a sighted person, and using knowledge about the way that the visual modality operates, how web sites are designed and how sighted people use websites to inform the identification of the content of interest. It requires assumptions about how pages are laid out and what “content of interest” actually is. Some of the factors potentially of use can be summarised as follows:
1. Website designers and studies of sighted web users both agree that users tend to look towards the centre of the screen (e.g. Schroeder, 1998) when looking at a page for the content of interest. Designers therefore place their content there. Left—right centrality is a good indication of content.
2. The periphery of the screen tends to be used for navigation bars. Location on the periphery may be a good indication of a navigation bar and a good indicator of not being content.
3. Content tends to consist of text, not hyperlinked, rather than images. The area of the screen with the most text is likely to be the content of interest.
4. Content is usually intended to appear in the first screen of information presented in the browser, on the assumption that users will not scroll to find it (e.g. Niederst, 2001). This implies that location near the top of the rendered web page is indicative of page content.
5. Content often begins with a headline, a piece of text (though sometimes an image is used) with a larger and bolder font, often different from the main body text.
6. Navigation bars and advertisement are often highly structured and graphical, so they consist largely of images or set text of a set size. To allow for small browser windows (i.e. people with small display screens or small browser windows) they tend not to take up too much of the screen. In general, then, the main content area will tend to be larger in area than any navigation element. Designers often fix the size of the content section to produce what is believed to be an optimum number of words per line for reading (e.g. MCU, 2003): otherwise, it could be assumed that on much larger screens navigation bars could not be expanded because they are graphical and structured, so the main content area, composed of text, would be permitted to expand to fill the space.
7. Users fail to see advertisements, quickly learning to avoid looking at anything that by location, shape or appearance suggests it is advertising (Schroeder, 1998): however, for WebbIE users an advertisement is usually rendered as a single link, so navigating around it seems unlikely to be a significant cognitive load.
8. The content section and navigation sections are mutually exclusive: one cannot contain the other.
9. Navigation bars usually extend down the left or right of the screen or across the top or bottom. Table 11 shows the results of examining the random sites. The left and top of the screen were most favoured for navigation bars, with very few on the right.
Table 11: Position of navigation bars on random web pages
Position of bar | Left | Top | Right | Bottom |
Random | 70 (32.6%) | 46 (21.4%) | 6 (2.8%) | 23 (10.7%) |
This is neither an exhaustive list nor a precisely-defined page model, but it does indicate some of the potential factors that might be weighed when analysing the rendered image and identifying content of interest. The layouts that these factors describe were implemented with frames, then with tables, and now with DIV elements, but the same visual layout results (Albedo Systems, 2004).
A prototype was therefore developed based on these factors to test how the identification of content of interest based on these approaches might be accomplished. The prototype employed the following approach:
1. Start with the Microsoft DHTML DOM, which is roughly equivalent to the W3C DOM but includes information on the visual rendering of objects on the page (e.g. position).
2. Parse the DHTML DOM just as the W3C DOM was processed for WebbIE re-presentation. Assign every node a score estimating how likely it is to contain the main content or a navigation bar.
3. Identify the highest-scoring node for each category.
The important step was the assignment of a score. This was based on the visual presentation points identified above. The scoring was as follows for potential content nodes:
1. Score = height of node in pixels X width of node in pixels + length of text content in characters. This takes into account the size of the node (larger means more likely to be content) and the amount of text (more text, more likely to be content). Nodes with no text content are rejected entirely.
2. Modify score by element. This process is intended to identify the area on the screen corresponding to (the start of) the content section. Areas on the screen are generated by container elements in HTML, which can in theory be any element using CSS but in practice tends to be TABLE child elements (i.e. the TD element) or the DIV element. Of the random sites, 77.2% used tables for some kind of layout, 19.1% used frames and 3.3% used DIV elements, so the TD element will be most important. Only 1.4% used none of these methods, relying instead on a purely linear layout of HTML content by the browser. The header H1 and H2 elements are also used because they may where used indicate the start of the content section, and their score is multiplied by a factor of 10 or 5 respectively. All other nodes are scored at 0, so cannot be content sections. One important implication of this is that pages that use FRAME elements to structure and layout sections will not work with this prototype: otherwise, these FRAME elements should be considered as container elements just like the DIV and TD elements, but that would require a more complex prototype to handle the different HTML documents involved and this was not considered to be a valuable investment of time for this prototype.
3. Modify score by vertical position. If the element starts more than 400 pixels from the top of the page canvas, it is rejected as a candidate for the content section. Web designers commonly design for visual users assuming a visual display unit (VDU) with a screen resolution of 768 pixels vertically. This equates to a limit of 400 pixels from the top of the canvas for elements that must appear when the page is loaded without the user having to scroll the page down when menu, status and tool bars are taken into account. The next most common monitor resolution has a lower resolution, so this figure is definitely an upper limit.
4. Modify by horizontal position. The score is scaled by a measure of centrality: if the rendered node straddles the mid-point of the page, it the centrality measure is 1, otherwise its centrality varies between 0 and 1 depending on the edge closest to the mid-point. A node running from the left edge to 0.25 of the screen width, for example, would score 0.5 (the right edge of the node is 0.5 of the way to the mid-point).
5. Ensure it does not contain the navigation section. The sections are mutually exclusive: if the node contains the navigation section (which must therefore be worked out first) then it is rejected. If this is not followed, the navigation section is often identified within the content section.
The prototype also attempted to identify navigation bars, if any. This is more problematic, because while it is reasonable to assume that every page has some kind of content section, the position, appearance and number of navigation bars is more variable. The following process was followed. Most of the reasoning is the same as for the content section. Only navigation bars at the left, right or top of the screen would be located, since the problem of identifying a bottom navigation bar in relation to an ill-defined bottom of the page and differentiating from content bodies with many links is too complex.
1. Reject any node not a TD or DIV.
2. Count the number of links (A and AREA elements).
3. Modify by horizontal position. Horizontal navigation bars use the same centrality measure as described above: vertical navigation bars use one minus the measure. This is crude, in that a wide vertical navigation bar may suffer a worse score than a narrow empty spacer TD element, but better avoids confusing a navigation section with a content section.
4. Modify by vertical position. Horizontal navigation bars are factored by a verticality measure, which is 1 minus the ratio of the top of the element to the total height of the page.
5. Modify by leftness. If the vertical bar element is entirely located to the left of the midpoint of the page, then its score is doubled. This helps to identify navigation bars (which tend to be on the left) from advertisement and content areas (more likely to be on the right).
The prototype displayed the results for examination. The results of running the prototype on the BBC News website can be seen in Figure 72 (three screens run together). The prototype is arguably successful in identifying the content of interest – the headlines of the main news stories – and conventional site navigation bars to the left and top of the screen.
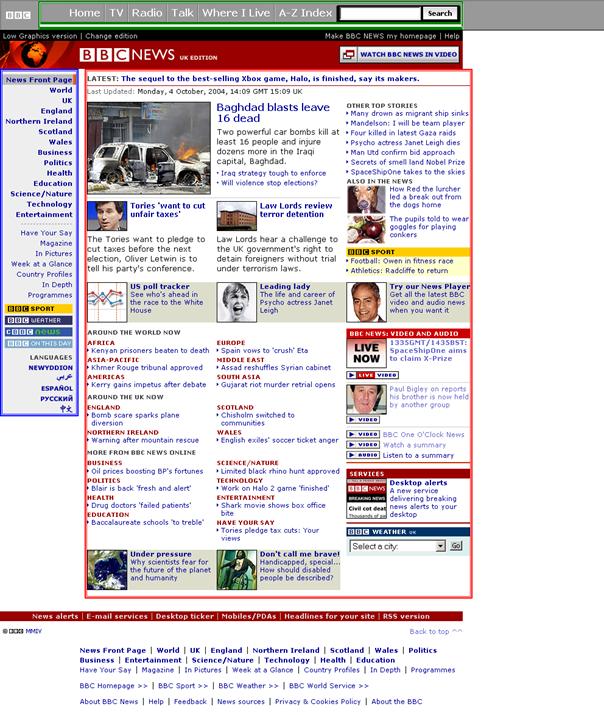
Figure 72: The BBC News website with content section (starting “LATEST:”, red outline) left navigation bar (starting “News Front Page”, blue outline) and top navigation bar (starting “Home”, green outline.) Outlines added by prototype.
At the same time, however, this page shows the limitations of the very simple model (content and navigation bars) employed so far. The various sections on the right of the screen might be identified as a navigation bar, but this is not a reasonable reflection of the variety of functions they afford. The large group of web links at the bottom is unaddressed: is this a navigation bar? Several key page functions, such as the search site function and the accessible version link, are not individually identified or not captured as belonging to the sections presented. It might be argued that these are difficulties due to the complexity of the web page: however, this might be balanced by the professional structure of the web page and the good fit of its content to the processing algorithm used. Figure 73 shows the problems that arise from a web page that does not so clearly fit the presumed model. Here, the four links at the top of the page might be regarded as a top navigation bar, but since each is in a TD element they are not aggregated to identify the structure as a whole. At the bottom of the page, only half of a two-column set of links that a sighted person might naturally identify as another discrete block of links is so labelled.
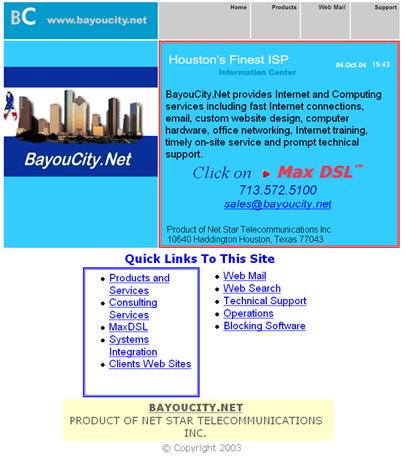
Figure 73: The content-identifying prototype fails to identify the top navigation bar and incompletely identifies a left navigation bar (starting “Products and Services”, blue). The content section (“Houston’s finest ISP”, red) is correct. From http://bayoucity.net/.
This is all-important when the next stage of re-presentation must be considered, how to re-present the content in the linear text form that WebbIE supports. The extent to which the process can be trusted to identify content correctly must influence the re-presentation process. If the accuracy is low navigating the inaccurate structure that will result may pose a greater cognitive load than proceeding through the un-altered content. Three possible ways to present the determined structure are first to change the order of the text in the linear text display – i.e. always put the content at the top and the navigation bar at the bottom, so each can be accessed quickly – second, to provide hotkeys to allow the user to move quickly to a determined section but otherwise leave the order of the text unchanged – possibly reducing the cognitive load of inaccurately-determined structures – and third, separating the sections off into different user interface elements, for example presenting the main content in a linear text display but the links of the navigation bar in a separate list control (as shown in Figure 74).
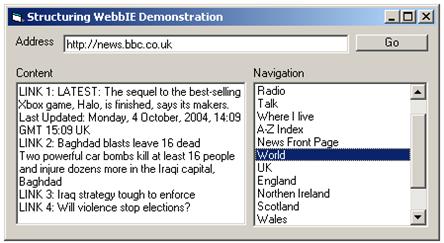
Figure 74: How a WebbIE might separate content and navigation sections.
The prototype was tested on the set of 107 selected and 118 random web pages. Its results were mixed. The ability to find content was more successful than the results for locating the navigation bars. Content was identified correctly for 72% of the selected pages and 67% of the random pages, but navigation bars for only 43% of the selected and 35% of the random pages. These figures are based on the judgement of a sighted experimenter deciding that the section indicated was or was not the content or navigation section. This was reasonable given the great variety in web page design and layout. Taking the navigation bars first, the main problem was their lack of consistency. Bars were doubled up, spread over multiple TD elements, or contained too few links to be recognised. The content section was better, but still suffered from mis-identification because of links in the main content, subdivisions of the content, lack of text and pages that do not in fact use DIV and TD elements to separate navigation from main sections (and arguably do not have such divisions).
Users increasingly rely on search functions on pages rather than intra-site navigation bars (Nielsen, 1997), so one task for a sighted user is likely to be the identification of search if the content section is not suitable. This is not supported in the content/bar model. Figure 75 is a good example of these problems. The content identification prototype has been successful: a side navigation bar and content section are identified. However, while the prototype has identified a top navigation bar, and managed to capture a reasonable section of the page, consideration of how this page might be re-presented based on this classification suggests several problems. First, there are in fact several sections to the navigation section above the main content: one to do with the user’s own account, two different sections for links around the site, and a form-based navigation mechanism including a search function. There are also two miscellaneous links to particular promotional items (“NEW: Garden & Outdoors” and “That Peter Kay Thing”) and a link to the main page (the Amazon.co.uk graphic next to the right of “NEW: Garden & Outdoors” and above the “Welcome” button). This is a large amount of content to be presented as a “navigation bar”, and contains much in the way of important content considering that this is an index page, notably the search function. It is questionable whether a strict delineation into sections is therefore desirable or helpful, since any such delineation is unlikely to truly reflect the underlying structure.
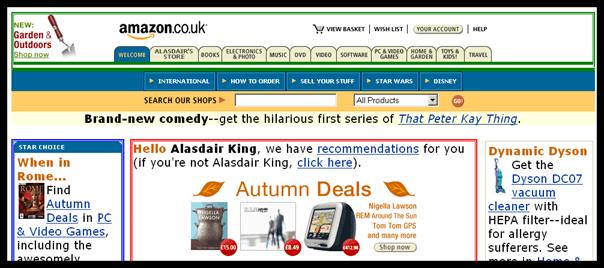
Figure 75: The identification of content and navigation bars on a web page (www.amazon.co.uk) by the content identification prototype. The green rectangle (top) indicates the top navigation bar. The blue rectangle (left) indicates the left navigation bar. The red rectangle (centre) indicates the page content. Rectangles added by the prototype.
That said, the success of the content identification process at this early stage suggests that it might be a useful approach to supporting the content identification task so necessary for users, and is worth pursuing in future WebbIE development. It is easy to try to improve the heuristics used: testing the results of these attempts takes longer, but the process as a whole is relatively simple.
4.4.8. Summary of results and WebbIE development
WebbIE is successful as a web browser for blind people compared to other leading assistive technology solutions (JAWS and Home Page Reader) and has real-world users who benefit from it. This is a successful implementation of a standalone application. Its major advantages are as follows:
· Its screen-reader neutrality permits it to be used by people who do not have access to JAWS (e.g. because that screen reader is not available in their market) or who have a preferred screen reader but require a simple and accessible interface.
· At the same time, because it does not self-voice, a user is able to employ their own screen reading solution and any skills they may have developed and is spared from having to manage multiple self-voicing applications on their machine (i.e. their screen reader and web browser.)
· It is widely successful at re-presenting web pages in an accessible format for blind people.
WebbIE can of course be further developed and improved, and these suggestions are detailed here. A discussion of WebbIE within the context of the re-presentation of visual content is presented in Chapter 5.
Firstly, WebbIE’s implementation could be improved on a number of simple technical points:
· Better frame support is required. It may be possible to take advantage of the DocumentComplete event, which fires on the arrival of each frame, rather than the current cumbersome loading of frame documents after the initial frame set page. It may not be able to handle the subsequent progression to new pages. WebbIE should better support the Back function in pages using frames, keeping track of web page frame states and cursor locations.
· The handling of error pages should be improved, when encountered as stand-alone web pages or parts of frame documents. The WebBrowser object provides error codes and information, and WebbIE should use this to make informed decisions on how to handle the content.
· The user should be better able to understand the progress of a large web page download. This is already done for files (e.g. executables) but in some circumstances, such as image-rich pages, the user may have to wait for an unacceptable time for web pages to be displayed in WebbIE. Sighted users can see the “busy navigating” image on a web browser and it reassures them that the browser is continuing to progress the download. Blind users might be given a similar cue, by way of a context sound for example. This will have to be handled with care, given the various problems with context sounds described in Chapter 3. The Stop command when used might also reassure the user as to why WebbIE appeared to hang, perhaps by confirming that all the HTML content of the page had arrived and that it has all been re-presented. This might be accomplished by a trivial check of the HTML code for the closing </HTML> tag. While this is optional it is generally used. A more advanced feature would require the querying of the hosting web server for the size of the HTML file that was expected through the WinSock interface (since the WebBrowser control does not provide this information).
Secondly are some more extensive developments. The need for fundamental changes is suggested by the JavaScript problems. The current system, relying on the WebBrowser object to trigger JavaScript events based on form elements, fails on many sites, notably those that provide web services. It would be possible to take a more interventionist approach and while processing the DOM record any JavaScript events and their associated page elements. The next step is to trigger the events through user actions in the linear text re-presentation – for example, mouseover. This should call the JavaScript associated with the DOM element directly, rather than relying on WebBrowser: this is possible through the DHTML DOM. This may provide more reliable and complete support for web page JavaScript, but it is likely that some pages will still fail to operate correctly. Ideally WebbIE would include a JavaScript parser and run-time environment itself. This would allow for complete control over the JavaScript and ensure that it worked, but this represents too great investment of time and effort.
The success of the re-presentation of web pages suggests that further development to perfect the re-presentation of Adobe Acrobat files by WebbIE is a good aim. The simplest solution is to use an existing translation component, as described in Section 4.3.3.3. The problems with licensing of these Open Source components can either be achieved through negotiation with the developer or distribution of the component separately from WebbIE, with WebbIE able to detect and use the component if found. This will allow users to navigate to Adobe Acrobat documents, make them accessible, enable any necessary reading tasks, and support a continuous browsing experience within the same application, rather than needing to change application and interface. Asakawa et al. (2000) proposed something similar, providing a consistent user interface for different information sources (e.g. Word, PowerPoint).
The relative success of the content identification prototype suggests that this might be further developed and employed in WebbIE. Ideally this will take the form of re-ordering the linear text content of the web page in WebbIE so that the content is at the top of the screen. If this proves to create too complicated a page layout, then simply providing a shortcut key to the user to take them to the content section is an inferior but simple alternative, although anything that requires the user to actively trigger a function risks not being used at all. It seems unlikely that changing the content would create significantly greater complexity, given the complexity that can already arise from re-presenting a rich web page laid out on a two-dimensional canvas in a linear text presentation. One interesting further application of this use of visual layout is to improve the process of assigning labels to form elements. The widespread use of the LABEL element would make any attempt to do this by WebbIE redundant, but the take-up of LABEL is low at present. Without this, forms can be very confusing. Analysing forms to assign labels according to proximity to form elements is worth examining. This could be used in conjunction with a function allowing users to identify and skip to forms on the page, useful for finding search boxes for example.
Finally, the problem of particular web service pages with very rich, therefore complicated, and JavaScript-powered interfaces might be addressed by the use of page templates, specific instructions for WebbIE that inform the processing and action of the page, for example identifying the best order for page order, or overriding native JavaScript functions, or labelling form elements. This is similar to the use of scripts in scripted screen readers, and reflects a desire to support users in performing the particular tasks afforded by the service pages. These could be updated by WebbIE over the Web automatically on start-up: this maintenance route would be required because changes to the pages supported by the templates would adversely affect their utility, and these changes would be completely at the whim of the site creator. However, identifying templates that have begun to fail and replacing them requires a certain commitment of time and resource. For this reason, only a few templates would be developed for very important or representative web service pages, such as one major web-based email site of the several available or a particularly popular site such as eBay. One definite website must be Google, given its importance to users as a major factor in information foraging, and indeed this template alone should justify the development. Another good candidate is the BBC: their Betsie system mandates a particular format, and 95% of BBC website pages comply, so a greater degree of confidence in the success of a template is possible. The template creation process should be documented and available to the user or their representative, should they have the ability to use it. If these user-developed templates could be distributed by interested users, perhaps through another automated and central process, some robustness against site changes and a greater number of templates might be achieved, but it would be wise to assume that such work is not forthcoming. Another possible solution is to interface with the web page though any defined accesskeys, which may be less prone to change than the HTML code structure and therefore require less maintenance. This is not the same as amending re-presentation according to the needs and preferences of specific users (Brusilovsky, 1996) but an attempt to address general problems through the support of particular websites: the adaptation is global, not user-specific.
Practical HTML Accessibility Guidelines
While the problem of generally low observance of W3C accessibility guidelines was ameliorated by WebbIE, web accessibility would be much improved if web designers made their web pages more accessible. One of the problems already discussed in Section 4.1.3 is the problem of web designers not understanding the guidelines to the degree that they can apply them effectively. A further problem that came to light during the WebbIE development was the problem of varying implementations of guideline-mandated accessibility features such as accesskeys and links that allow users to skip to the content of interest. The guidelines do not mandate how solutions should be implemented, which makes it difficult for web browser designers to know how to take advantage of them. One solution might be guidelines that are very simple and explicit in what HTML code should be used to apply them: they should define implementation rather than function. This would allow experts to determine the content of these practical guidelines and promote their use as straightforward. It is also the case that not all accessibility priorities are equal. Failing to label frames may be a problem, but probably will not. Using tables for mark-up instead of stylesheets does not necessarily have any impact on how well a site works. A shorter list of simple mandatory guidelines will minimise web designer work for maximum benefit. Of course, web designers do not follow other simple guidelines such as Borges et al. (1998) so there may be no benefit in new guidelines no matter how simple. However, a set of practical guidelines is presented here with the aim of capturing some of the lessons learnt from WebbIE development (Table 12).
Table 12: Practical HTML accessibility guidelines
Identify the start of the content of interest and put a descriptive H1 element immediately before it. Either this heading or the content itself must be marked up with an id of “content”. |
Mark up navigation areas with “class='sitenav'”. This might be applied to any feature, such as frame, or a table cell, or a list. There might be multiple areas: these may be marked up with “class='sitenav2'” or “class='sitenav_left'” or anything else so long as “sitenav” is the first seven letters. Frames should be labelled in the same way. |
Provide a skip-to-content link at the very top of the page using the following code: <div style=”position:absolute;left:-100%;”> <a href=”#content” id=”skip”>Skip to content</a> </div> Alternative: use CSS to allow the content of interest to be placed immediately at the beginning of the HTML code, no matter where it ends up being rendered in a visual presentation. |
Use the accesskeys defined by the UK Government on their e-Government site. Never use D as an accesskey because it conflicts with D used in most browsers to access the address bar. |
Provide ‘alt’ information for every image and embedded content, and use “alt=''” for nearly all of them. If you are not sure, use “alt=''”. However, never use “alt=''” for an image used for a link, use the title of the page the link is pointing at. |
Do not use JavaScript ever. If you are made to use JavaScript only use the onclick, onload, onreset, onsubmit and onunload events, nothing else. Associate the JavaScript with form input buttons, check buttons and option boxes, not text or images. |
5.Conclusions
Chapters 3 and 4 have presented the two re-presentation systems, TeDUB and WebbIE, and discussed how they re-present visual content to blind people. This chapter describes the achievements and conclusions derived from this work, presents some general principles on handling visual content derived from the results, and describes potential further work.
5.1. Research conclusions and achievements
This thesis described in Chapter 2 how the visual content of information sources intended for sighted users poses a problem in re-presentation to blind people by means of computer-mediated transcription. Even when basic problems of access to the non-visual information content (e.g. text and symbolic content) are resolved, the visual content of an information source can provide structure (e.g. defining headlines and stories in newspapers), permit problem-solving (e.g. calculating circuit diagram properties) and be content in and of itself (e.g. spatial information in floor plans). Communicating this visual content to blind users poses two problems: whether the content is amenable to transcription from the original electronic source and whether the content can be practicably communicated by means of audio and haptic interfaces to blind people. Chapter 2 identified three types of information source: textual, diagrammatic and pictorial. Visual content plays a different role in each and might be handled in different ways: pictorial information (e.g. pictures) is not amenable to computer-mediated transcription with current technology, but two re-presentation tools were developed for diagrammatic (TeDUB) and textual (WebbIE) types of information source.
The TeDUB research presented a diagrammatic information source and made some effort to communicate the visual content of the original diagram, in this case absolute positional information (e.g. node A is above node B on the page.) The research established that diagram domains where re-presentation was most successful were domains where diagrams possessed an original format amenable to unambiguous transcription into the re-presented form (e.g. XML-based XMI-format UML diagrams) Amenable formats allowed blind users to access information sources that were previously inaccessible: it was certainly harder for them to utilise the information content than for sighted users but this basic access was an improvement.
The two key results from the TeDUB project form the basis for the guidelines given below for re-presenting visual content to blind people. The first was that the re-presentation of visual content (i.e. spatial layout) via audio and haptic interfaces was feasible (users could explore and identify the spatial layout) but, in practice, difficult to use (users found performing actual tasks difficult and the tool required training). One explanation for this is poor implementation of the audio and haptic interfaces: however, with several iterations of development and evaluation with significant numbers of end users, it is to be hoped that the implementation was at least satisfactory. It might be that a better solution could be found with more powerful expensive equipment, such as a PHANToM device, or a different approach such as the NOMAD system. However, the project was constrained by what was possible with commercially-available and inexpensive hardware and computer-mediated transcription, and user evaluation was also generally successful. Users were able to operate the audio-haptic interfaces successfully and were positive about them. The second explanation for the problems users encountered in performing tasks with the tool is that the mental overhead of synthesising the spatial information provided through the audio and haptic interfaces was too great. Research suggests that blind people are capable of comprehending and using spatial information but it appeared that for the tasks, knowledge domains and audio-haptic interfaces studied in this thesis the process of obtaining spatial information for the diagrams, building a mental model and identifying meaning and purpose from the spatial information, and performing tasks was very costly. In situations where there is absolutely no alternative, blind people will of course use costly processes to obtain information they seek (if they do not abandon the task entirely) but with these diagrammatic information sources it appeared that the benefits of obtaining the spatial information were not high enough to justify the high cost of doing so and an alternative re-presentation ignoring the visual content would be of greater utility. More generally the inference might be drawn that the communication of spatial information in diagrammatic information sources should not be regarded as likely to be of major assistance for blind people attempting to use such diagrams.
The alternatives to presenting the visual content are to remove the spatial layout entirely or to communicate what it means. The second key result from the TeDUB research is that the second alternative may be more beneficial: a good way to approach the problem of blind people unable to access visual content is to identify the tasks attempted by sighted users with the diagrams that for blind users of the same diagrams could be supported directly by automated functions rather than relying on the blind user’s ability to understand the visual content of the diagram. For example, users rated highly the automated route-finding function in floor plans but found it difficult to perform the same kind of tasks in electronic diagrams where they were forced to obtain information by means of navigating the spatial layout of the diagram using the audio and haptic interfaces. This provision of specific functions to support popular or vital tasks is consistent with the model of diagrammatic information sources: if a re-presentation of a diagram within a tool for blind people can feature these dedicated functions then it can exhibit a profile of computational efficiency similar to the original diagram for sighted people. This approach should allow the blind user to benefit from and utilise the re-presentation in the same way as sighted people: without these functions the re-presentation may be informationally-equivalent but have different computational efficiency. This is a particular problem for diagrammatic information sources because support problem-solving through spatial layout and spatial layout is difficult for blind users, who may therefore find themselves to be considerably less efficient in exactly those tasks for which the original diagram for sighted people was designed. If spatial layout is the most difficult thing to communicate to blind people then accessible re-presentations will fail even where the spatial content is available. Dedicated functions are a way to resolve this impasse.
WebbIE is an accessible web browser of comparable performance to other leading assistive technology programs (JAWS and Home Page Reader) developed throughout the course of this research. It does not self-voice, allowing users to employ their own screen reader any their skills and abilities in doing so, and it is screen-reader-neutral, allowing people who do not have access to expensive IE-capable screen readers in their language to access and use web pages. It is in actual use by blind people and is of real benefit to users. It provides access to a textual information source, re-presenting web pages in a linear text format without reference to the visual content of the web page when rendered for sighted people. This is justified by the assumption that the key content in textual information source is the text content, with visual content being used only to structure and highlight and therefore able to be dropped entirely from the re-presentation without significant loss to the user This simple approach was strictly effective in terms of making content of web pages accessible (and was common to all of three programs tested): problems arise where visual content was employed to structure web pages to allow sighted users to quickly identify the content of interest, key in allowing the faster completion of information foraging tasks when web browsing. User responses indicated that the problem of identification of the content of interest was key and the simple pragmatic skip links function – a dedicated task-supporting function like the route-finding task support in the TeDUB system – appeared to be successful in meeting this need. This is consistent with the TeDUB findings: the simplicity of the function made it easy and quick to use, helping it contribute to providing a similar computational efficiency for use of documents of this textual information source type. A re-presentation of a diagram might have many task-supporting functions. WebbIE suggests that the re-presentation of a textual information source might also have task-supporting functions (e.g. identification of content of interest) but there may be fewer of them. Less visual content is used in the original textual information source and therefore less work has to be done in the re-presentation to achieve a similar cost profile for the tasks to be achieved.
5.2. General principles for re-presenting visual content for blind people
Three general principles can be identified from the research conclusions described in the previous section:
· Support user goals and tasks.
· Communicate what visual content implies, not the content itself.
· Approach spatial information with caution because it is inefficient.
5.2.1. Support user goals and tasks
Information sources have conventions on use, aims and presentation. These support user goals and tasks. A successful re-presentation of an information source will identify these goals and tasks and support them.
Where the TeDUB tools supported information foraging goals and tasks, and where the tasks that users were set reflected these goals the system was better received by users (e.g. EuroNavigator, UML diagrams). Where the users were set tasks not supported by the interface but requiring user effort, e.g. working with digital circuit diagrams, users reported more problems. By contrast, when depicting floor-plans, an information source that is intrinsically spatial and therefore not on the face of it amenable to re-presentation as a graph of nodes or hierarchy, the provision of explicit task support (route finding) was very popular and helped users to perform a task that was not dissimilar to those required in the digital circuit diagrams (finding a path through the diagram was a key task) but there caused great difficulty.
WebbIE re-presented a textual information source, web pages, where the goals are to find information and use service sites. The first goal requires support for information foraging tasks. WebbIE is a web browser, so it provided common supporting functions such as Back. However, blind people cannot perform information-foraging tasks effectively since they cannot use the visual presentation of a web page to determine the content of interest. The simple WebbIE function “skip links”, allowed the user to perform this task very efficiently, and was therefore successful. The function was based on simple heuristics: web page content usually does not have links. More advanced techniques analysing the visual presentation of a web page may follow, but their basic drive must be the same: to let blind users get to the content of interest as quickly and simply as possible. WebbIE’s addressing of service sites is less successful, and one of the reasons is WebbIE’s handling of forms. The interface allows users to complete forms in a simple and straightforward way, which is successful. However, it does not support the completion of the form by helping the user to identify what the form wants: it relies on the designer creating a form that reads well when linearised. This can lead to confusing and unclear forms. The solution is addressed by the next principle.
5.2.2. Communicate what visual content implies, not the content itself
Visual content can structure or add semantics to textual and diagrammatic information sources. Both are inferred by the sighted user looking at the information source. A blind user can either be presented with the visual content, and left to infer the same things as the sighted user, or be presented with the inferred structure or semantics. If possible, latter approach should be adopted. This is much more efficient for a blind user.
WebbIE provides a good example. A blind user could be presented with a way to explore the layout and appearance of a web page and left to work out what the layout and structure mean. The user may find this impossible, and the potential benefits (a possible understanding of the structure) are far outweighed by the cost in time and effort. A better solution is to process the visual rendering of the page to identify the structure and content of interest and structure the accessible re-presentation accordingly, as demonstrated by the WebbIE content-identifying prototype.
The TeDUB tools suggest that users had difficulty in using spatial information to build an understanding of technical diagrams, but were more comfortable with the re-presentation of aggregation relationships by means of the hierarchy.
It may not be possible to perform this process of analysis: the information source may be too variable, so the results are too unreliable for users to benefit. Web pages may fit into this category: what conventions exist are very flexible and inconsistent. Because conveying spatial information to a blind person is so inefficient, if an automated method of identifying semantics and structure is not available, it is better to re-present the information source content without the visual content entirely. The user will do their best and not waste time acquiring information of marginal value.
5.2.3. Present spatial information with caution
Some information sources naturally lend themselves to a spatial representation. The technical diagrams in the TeDUB work are a good example. Some users indicated that the use of a joystick or 3D sound to convey the layout of the diagram was helpful, and that using the joystick to move around the graph of nodes or get an overview of the diagram contents was effective. It is reasonable to conclude that presenting spatially-organised information through a spatial re-presentation may be effective in some limited circumstances, such as the UML diagrams.
This is not to say that the original layout of the diagram need be maintained. The benefits of spatial information appear to be limited. Respecting the original layout must take second place to ensuring that a spatial re-presentation is effective. For example, it is reasonable to re-arrange nodes in a graph to allow the interface to communicate their connections clearly (so no two nodes exist in the same direction) even though the original spatial layout is lost. Communicating the original spatial re-presentation should be limited to circumstances where it is likely to be beneficial.
The arrangement of nodes is dependent on the diagram domain and the user tasks that the arrangement should support. However, here is a general set of guidelines on how a hierarchy of nodes might be ordered, derived from the experience with the TeDUB work:
Structuring a hierarchical re-presentation
1. Provide a single top node. This should be “home” for the hierarchy, where navigation starts, and where information about the whole file is stored. This provides a consistent reference point for users.
2. Order nodes within their levels consistently. The order chosen should be determined as follows:
a. Order informed by order in the information source itself. Examples include re-ordering nodes in a UML State Chart in sequence so that start nodes are at the beginning and end nodes at the end of each level, or ordering by time in a UML Sequence diagram.
b. Order informed by task analysis. Even if a dedicated function is not required to support a particular task, the hierarchy structure might be ordered to support common user goals. For example, UML Use Case and UML Sequence diagrams both contain ordering by node type (e.g. all Actors before all Use Cases.)
c. Order informed by familiarity. Users are accustomed to lists sorted by alphabetical order (e.g. Windows Explorer) and expect lists generally to be alphabetical. This should be the default order.
3. Keep the structure of the hierarchy simple. This means a minimum of levels and nodes, even if they must contain more information. Blind users had problems with UML State Charts diagrams (with many levels) and the Europe hierarchy (the National Artists node contained no information, but child nodes that might have been amalgamated to make the navigation simpler). They preferred UML diagrams with relationship information applied to the nodes connected by the relationships rather than UML diagrams with the relationships represented as extra nodes in their own right.
5.3. Further work
The research suggests several avenues for further investigation. Specific improvements in the operation of the TeDUB and WebbIE applications are described in the conclusions to Chapters 3 and 4: this describes more general possibilities.
5.3.1. WebbIE future work
The re-presentation of web pages would benefit from still-better support of information-foraging behaviour. The principal improvement would be a system that intelligently re-arranges the linear order of the text content to reflect the structure of the web page as determined by analysis of the visual appearance of the rendered HTML. This is dependent on the consistency of web page conventions, which will make the process more difficult. User evaluation will be required to determine if the extent and significance of presenting incorrectly-re-presented web pages to users is such that the user is better left to explore the page without any re-arrangement. The main aim is to enable the user to identify the content of interest quickly and easily: ideally there is no process of identification at all, and the content of interest is implicitly obvious. The use of a simple heuristic formula to perform this function was discussed in Chapter 4: other approaches from the field of data-mining might be employed, such as training a neural net to identify content of interest. Another solution that might be investigated includes the generation of a summary for a new web page, based on analysis of the HTML code (e.g. headings), the title of the web page, and the results of analysis the visual content. This will allow the user to determine its relevance without having to explore the page. However, this is exactly what search engines (e.g. Google) try to do, and since they already make considerable efforts in this area, it may be better to take advantage of their efforts and simply provide a dedicated function supporting Google searches. Better support for information foraging would also militate against requiring the user to change application when a non-HTML file is accessed (e.g. having to download a file to view it in another application). Support for opening Adobe PDF files (and possibly Microsoft Word files, even though they are accessible through Word) should allow more seamless and efficient foraging.
The user evaluations also point to supporting the use of service pages. Analysing the visual presentation of forms would assist this, linking form element labels (e.g. “Enter your search terms” for a text input box) to the form element correctly by analysing the layout. A means to identify and access individual forms would also be helpful. However, the complex interface presented by some service pages (e.g. Yahoo! Mail) and the positive benefits of access to even a handful of these sites suggests that more drastic action would be justified, even if it only supports a handful of websites: the dedicated Google interface is one example of this approach. A few identified websites (e.g. Google, Yahoo! Mail, and the BBC) should all have dedicated functions to support their use. This is the approach suggested by many proxy server solutions, with limited success: however, the benefit is that even support of only half-a-dozen sites would still be of benefit and keep the support requirements to a minimum. Ideally the process of support would involve a generalised scripted solution defining how a particular site might be supported, able to be amended and updated quickly or rebuilt for a new website as required. Since parsed HTML is available through a hierarchical DOM, a transformation language such as XSL might be employed: this would also take advantage of any future expansion of XHTML usage. The success of this approach will depend on the variability of website HTML for the selected service pages: a process of tracking any changes in a selection of service websites over time will commence now to obtain some measure of the rate of change. Ideally a self-adapting transformation would allow minor changes to be compensated for. An interesting development is the use of XML User Interface Language (XUL), an interface mark-up language that can be used to specify user interface components over the web (Hyatt et al. 2001). This allows the kind of interfaces found on service web pages to be encoded and rendered as actual GUI components (e.g. Serra, 2004). Microsoft is working on a similar system (Microsoft, 2004m). Widespread adoption may make the problem of complex interfaces rendered in HTML redundant (or more definitely a screen-reader problem). More generally, service sites are increasingly offering their services through published and freely-available APIs. These APIs and services may be transcoded by a proxy server as a matter of course, for example to support consumer devices. The Google search API has already been discussed: Amazon also provides an API to its bookstore allowing searching and browsing its catalogue (Amazon, 2004b). These APIs allow well-structured and unambiguous contents to be accessed and manipulated by the web client. They allow fully-accessible re-presentations to be developed. The problem is that many service pages operate in competition with each other: a user might be happy to obtain all their media from the BBC website, but might prefer not to be restricted to the Expedia website when shopping for flights. Several service sites might have a claim to be supported for a given category (e.g. Expedia, Orbitz, LastMinute and Travelocity might all be contenders for travel) so the chance that one site would suffice is lessened.
Another potential technology ready for exploitation in WebbIE is Really Simple Syndication (RSS). This allows websites to provide a simple data file that contains information on new content, and is used by news and personal weblog sites (Winder, 2004). RSS is an XML format, so it is easy to transform and navigate, and has a very simple and defined structure. An RSS reader integrated with the user’s web browser (e.g.. Mozdev, 2004) handles the presentation. RSS does not, unlike HTML, contain information on visual presentation, only well-defined structure, so it is perfect for re-presentation for blind people. For example, a Guardian newspaper reader can subscribe to the Guardian RSS feed (Guardian, 2004) and on request receive a list of the latest articles and links to them. An accessible RSS reader built into WebbIE would allow users to subscribe to feeds and receive an accessible list of its content through a dedicated interface.
An engineering development for WebbIE is to build its HTML-to-text functionality into a standard Windows control or DLL. This might be used just as the WebBrowser control is used widely in most accessibility solutions. The opportunity to access a text-only re-presentation of an HTML document might permit many other new applications to be built on this simple library. This would allow the development of a self-voicing version of WebbIE would be relatively easy to construct if the basic WebbIE components can be constructed as a library. This would allow the self-voicing approach to be contrasted with the screen-reader approach. Support for Aural Style Sheets and better presentation of HTML (e.g. support for the EM and STRONG elements through prosody) could be provided for a self-voicing WebbIE. Another possible application is a version of WebbIE that operates on a PDA and provides a more effective and text-based user interface.
Inaccessible content used to provide a non-HTML user interface (Java and Flash) still poses a problem for WebbIE. The current approach is to present the content directly to the user’s screen reader and leave the screen reader to access it (for instance, using the Microsoft Active Accessibility API.) WebbIE might instead attempt to access the embedded content and re-present it to the user in the same linearised text format as for HTML. This might be done through a dedicated API provided by the embedded content, similar to the way that WebbIE accesses the DOM, but Java and Flash lack such APIs. This puts WebbIE in the same position as a screen-reader, accessing the content through MSAA or the Java Accessibility API [27]. The advantage would be the ability of WebbIE to integrate the presentation of the embedded content with the general and successful HTML re-presentation already developed.
5.3.2. TeDUB future work
The TeDUB tool can be developed for better support of user tasks and goals. More high-level search and information foraging functions should be provided, such as the ability to view linear lists of search results by type, name or characteristics. Another approach, suggested by the WebbIE work, is better to provide a linear textual re-presentation of the content. This was observed to be well-supported in the UML diagram domain, where users were accustomed to text presentations in this form. Re-presenting a UML model as a set of HTML documents, one for each node, would allow users to use their familiar web browser: alternatively, it might be easier to create one single large HTML document for a single model.
There is a considerable amount to do to ensure the TeDUB system is able to handle different XMI versions. This does not preclude considering what other diagrams might be able to be re-presented with the tool [28]. Any electronic format that can be read and understood (those with a published file format) that supports a diagrammatic information source (e.g. one that is generally a connected graph) is a candidate, but with the current implementation XML-based formats would be most easily supported. Some diagram design tools now support export in formats that are worth investigation, such as UML exported from the Dia application (Dia, 2004). However, a problem familiar from the problems with web pages is apparent. Unlike XMI, which captures the UML information in a model explicitly and completely, many design tools support only SVG renderings of diagrams (in addition to their own proprietary format). This is a visual presentation of the diagram content, not the diagram content itself: a Class in a UML diagram might be represented in an SVG file as a set of lines and text and make sense when rendered, but this will be impossible to import directly. The image analysis techniques developed by the TeDUB project partners might be brought to bear, since they can combine such low-level elements into meaningful high-level components. However, these techniques are currently limited: diagrams must be produced in accordance with a set of requirements that cannot be applied to the export functions of design tools. Experience with HTML suggests that it would be to hope in vain that the design tools might export SVG with meaningful structure that reflects the information content rather than the visual representation (e.g. explicitly marking up Class elements: even if they are still composed of lines the Class can be identified and presented correctly.)
The ability to transform XMI and other diagram types (e.g. Geospatial Markup Language, Bobbitt et al., 1999) into SVG does suggest an alternative route, that of the automated production of usable tactile diagrams. Conversion to SVG can be followed by re-arrangement to conform to tactile diagram standards (e.g. size of features, shapes, separation of items) and to fit on a swell-paper page (e.g. A4). The text content could be turned into Braille (e.g. Blenkhorn, 1997) and sized and placed so as to be readable. Applications already exist to render and print the resulting SVG, so the result is an automated tactile diagram production process. An alternative is to produce Microsoft’s Vector Markup Language (VML) instead of SVG: this can be rendered and printed directly from Internet Explorer or the WebBrowser object. Nentwich et al. (2000) describe just such a system. Both processes would be limited by the small size of diagrams that could be produced and the use of Braille: the alternative, to supply a NOMAD-style system, has been described in Gardner and Bulatov (2004). The advantage of this process it that it takes advantage of existing SVG technologies.
5.3.3. Content creation
Finally, an unaddressed problem throughout this thesis has been the role of blind people as creators rather than consumers of information sources. There is definitely a need for UML Diagram users to be able to create their own UML diagrams. This was a common request from blind users during the UML evaluations. UML is a design tool and is used with automated design tools, so to use it properly users must be able to produce UML of their own design in the XMI format so that it can be exchanged and worked on by other, possibly sighted users with different applications. A more general case of the creation of diagrammatic information sources (e.g. box and pointer diagrams) might also be supported if the application allows a blind user to create the nodes and connections, lays out the content rationally and allows graphical output for sighted people (e.g. SVG or bitmap graphics) as used in Nentwich et al. (2000).
Web page creation is more complex. Lenhart et al. (2004) state that 44% of (sighted) American Internet users had created content online: the majority of this is adding content to websites (e.g. submitting photos or comments) which must be supported through an accessible browser, but some 13% of users also had their own websites. Blind users can, of course, write HTML documents in a text editor or word processor. However, they may have a sub-standard visual appearance and therefore be judged as being poor quality by sighted users. A solution to this is suggested by the automated applications for sighted people that allow people without HTML or design skills to create attractive websites (often online diaries) such as Blogger (2004). Blind users might use these sites themselves (although Blogger failed to work in WebbIE because it used an ActiveX control). However, a dedicated solution might provide firstly a more accessible and usable dedicated interface and also make more effort to ensure that the output from the application was very standard and accessible. In fact, the HTML structure produced might be publicised and standardised to encourage blind web browsers to use these web pages and even create dedicated accessibility techniques to take advantage of the accessibility functions, in a self-catalytic process of positive reinforcement that might act as an exemplar of good web design.
6. References
- Adamic, L.A. & Huberman, B.A. (2001)
- “The Web’s Hidden Order.” Communications of the ACM. Vol. 44 No.9. September 2001. ACM Press, New York, USA, 2001. pp55-59.
- Adobe (2004a)
- “What is Adobe PDF?” Available online at http://www.adobe.com/products/acrobat/adobepdf.html. Viewed August 2004.
- Adobe (2004a)
- “Adobe Creative Suite.” Available online at https://eurostore.adobe.com/cgi-bin/uk1/templates/main. Viewed August 2004.
- AFB (2004)
- “ADA and the Internet.” American Foundation for the Blind website. Available online at http://www.afb.org/Section.asp?SectionID=3&TopicID=240&DocumentID=2411. Viewed November 2004.
- Ahlberg, C. & Shneiderman, B. (1994)
- “Visual Information Seeking: Tight Coupling of Dynamic Query Filters with Starfield Displays.” CHI ‘94: Proceedings of the SIGCHI conference on Human factors in computing systems. Adelson, B., Dumais, S. & Olson, J. (Editors) Boston, Massachusetts, USA. ACM Press, New York, USA, 1994. pp313-317.
- Albedo Systems (2004)
- “The price of frames.” Available online at http://www.albedo.co.uk/texts/webdesign/frames.cfm. Viewed September 2004.
- Aldrich, F.K. & Sheppard, L. (2001)
- “Tactile graphics in school education: perspectives from pupils.” British Journal of Visual Impairment. Vol. 19(2), 2001. pp69-73.
- Alexa (2004)
- “Alexa Web Search – Top 500.” Available online at http://www.alexa.com/site/ds/top_500. Viewed September 2004.
- All Things Web (1999)
- “How Much Is Too Much?” Available online at http://www.pantos.org/atw/35654.html. Viewed September 2004.
- ALPAS (2004)
- “DIFFWEB.” Available online at http://www.diffweb.com/. Viewed December 2004.
- Alternative Media Guide (2000)
- “Guidelines for producing instructional and other printed materials in alternate media for persons with disabilities.” Available online at http://www.htctu.fhda.edu/publications/guidelines/altmedia/altmediaguide.pdf. Viewed August 2004.
- Alty, J.M. & Rigas, D.I. (1998)
- “Communicating Graphical Information to Blind Users Using Music: The Role of Context.” CHI ‘98: Proceedings of the SIGCHI conference on Human factors in computing systems. Atwood, M.E., Karat, C., Lund, A., Coutaz, J. & Karat, J. (Editors) Los Angeles, California, USA. ACM Press/Addison-Wesley Publishing Co., New York, USA, 1998. pp 574-581.
- Amazon (2004a)
- Amazon UK website. Available online at http://www.amazon.co.uk. Visited November 2004.
- Amazon (2004b)
- “Web services.” Available online at http://www.amazon.com/gp/browse.html/104-3049291-0284745?%5Fencoding=UTF8&node=3435361. Viewed December 2004.
- A-Prompt (2002)
- “Web accessibility verifier.” Available online at http://aprompt.snow.utoronto.ca/. Viewed February 2004.
- Asakawa, C. & Itoh, T. (1998)
- “User Interface of a Home Page Reader.” Assets '98: Proceedings of the third international ACM conference on Assistive technologies. Blattner, M.M. & Karshmer, A.I. (Editors) Marina del Rey, California, USA. ACM Press, New York, USA, 1998. pp149-156.
- Asakawa, C. & Takagi, H. (2000)
- “Annotation-based transcoding for nonvisual web access.” Assets '00: Proceedings of the fourth international ACM conference on Assistive technologies. Tremaine, M., Cole, E. & Mynatt, E. (Editors) Arlington, Virginia, USA. ACM Press, New York, USA, 2000. pp172-179.
- Asakawa, C., Takagi, H. & Itoh, T (2000)
- “Document Reader for the Blind.” Technology and Persons with Disabilities Conference (CSUN) 2000. Available online at http://www.csun.edu/cod/conf/2000/proceedings/0064Asakdawa.htm. Viewed December 2004.
- Asakawa, C., Takagi, H., Ino, S. & Ifukube, T. (2002)
- “Auditory and Tactile Interfaces for Representing the Visual Effects on the Web.” Assets '02: Proceedings of the fifth international ACM conference on Assistive technologies. Hanson, V.L. & Jacko, J.A. (Chairs) Edinburgh, UK. ACM Press, New York, USA, 2002. pp65-72.
- Bach-y-Rita, P., Collins, C.C., Saunders, F.A., White, B. & Scadden, L. (1969)
- “Vision substitution by Tactile Image Projection.” Nature Vol. 221, 1969, pp963-964.
- Bach-y-Rita, P., Kaczmarek, K.A., Tyler, M.E. & Garcia-Lara, J. (1998)
- “Form perception with a 49-point electrotactile stimulus array on the tongue: a technical note.” Journal of Rehabilitation Research and Development Vol. 35(4), October 1998, pp427-430.
- Baillie, C., Burmeister, O.K. & Hamlyn-Harris, J.H. (2003)
- “Web-based Teaching: Communicating Technical Diagrams with the Vision Impaired.” OZeWAI 2003, Bundoora, Victoria, Australia. Available online at http://opax.swin.edu.au/~303207/OZeWAI20031.html. Viewed December 2004.
- Barkowsky, T. (2001)
- “Mental processing of geographic knowledge.” Spatial Information Theory - Foundations of Geographic Information Science. Montello, D.R. (Editor) Springer, Berlin, 2001. pp371-386.
- Barkowsky, T. (2003)
- “Modeling mental spatial knowledge processing as integrating paradigm for spatial reasoning.” Foundations and applications of spatio-temporal reasoning (FASTR) - Papers from the 2003 AAAI Spring Symposium. Guesgen, H.W., Mitra, D., & Renz, J. (Editors) AAAI Press, Menlo Park, California, USA, 2003. pp1-2.
- Barnicle, K. (2001)
- “Usability testing with screen reading technology in a Windows environment.” CUU '00: Proceedings on the 2000 conference on Universal Usability. Arlington, Virginia, USA. ACM Press, New York, USA, 2000. pp102-109.
- Bauwens, B., Engelen, J., Evenepoel, F., Tobin, C. & Wesley, T. (1994)
- “Increasing access to information for the print disabled through electronic documents in SGML.” Assets '94: Proceedings of the first annual ACM conference on Assistive technologies. Gilbert, E.P. (Editor) Marina Del Rey, California, USA. ACM Press, New York, USA, 1994. pp55-61.
- Bayles, M.E. (2002)
- “Designing Online Banner Advertisements: Should We Animate?” CHI ’02: Proceedings of the SIGCHI conference on Human factors in computing systems. Minneapolis, Minnesota, USA, 2002. ACM Press, New York, USA. pp363-366.
- BBC (2004a)
- “Betsie Home Page.” Available online at http://www.bbc.co.uk/education/betsie/. Viewed February 2004.
- BBC (2004b)
- “BBC – Radio 4 – Home.” Available online at http://www.bbc.co.uk/radio4/. Viewed August 2004.
- Bennett, D.J. & Edwards, A.D.N. (1998)
- “Exploration of Non-seen Diagrams.” The Fifth International Conference on Auditory Display (ICAD98), Glasgow, U.K. Available online at: http://www.icad.org/websiteV2.0/Conferences/ICAD98/papers/BENNETT.PDF. Viewed August 2004.
- Berger, A.L. & Mittal, V.O. (2000)
- “OCELOT: a system for summarizing web pages.” Proceedings of the 23rd Annual International ACM SIGIR Conference on Research and Development in Information Retrieval. Belkin, N.J., Ingwersen, P. & Leong, M. (Editors) Athens, Greece. 24-28 July 2000. ACM Press, New York, USA. pp144-151.
- Berla, E.P. (1982)
- “Haptic perception of tangible graphic displays” Tactual Perception: a sourcebook. Schiff, W. & Foulke, E. (Editors) Cambridge University Press, Cambridge, UK, 1982. pp 364 - 386.
- Bernard, M., Liao, C.H. & Mills, M. (2001)
- “The effects of font type and size on the legibility and reading time of online text by older adults.” CHI ‘01 extended abstracts on Human factors in computing systems. Seattle, Washington, USA. ACM Press, New York, USA, 2001. pp175-176.
- Bernard, M.L. (2003)
- “Criteria for optimal web design (designing for usability).” Available online at http://psychology.wichita.edu/optimalweb/text.htm. Viewed November 2004.
- Berners-Lee, T. (1989)
- “Information Management: A Proposal.” Available online at http://www.w3.org/History/1989/proposal.html. Viewed November 2004.
- Berners-Lee, T. (1998)
- “The World Wide Web: A very short personal history.” Available online at http://www.w3.org/People/Berners-Lee/ShortHistory.html. Viewed November 2004.
- Berners-Lee, T. & Connolly, D. (1995)
- “Hypertext Markup Language 2.0.” Available online at http://www.w3.org/MarkUp/html-spec/html-spec_toc.html. Viewed November 2004.
- Berners-Lee, T., Hendler, J. & Lassila, O. (2001)
- “The Semantic Web.” Scientific American, Vol. 284, No. 3. May 2001. pp34-43.
- Berry, J. (1999)
- “Apart or a part? Access to the Internet by Visually Impaired and Blind People, With Particular Emphasis on Assistive Enabling Technology and User Perceptions.” Information technology and disabilities, Vol. 6(3), 1999. pp1-16.
- Blattner, M., Sumikawa, D. & Greenberg, R. (1989)
- “Earcons and icons: their structure and common design principles.” Human-Computer Interaction, Vol. 4, No.1. 1989. pp11-44.
- Blauert, J. (1983)
- “Spatial Hearing: The Psychophysics of Human Sound Localization.” MIT Press, Cambridge, Massachusetts, USA. 1983.
- Blenkhorn, P. (1997)
- “A System for Converting Print into Braille.” IEEE Transactions on Rehabilitation Engineering. Vol. 5, No.2, June 1997, pp121 - 129.
- Blenkhorn, P. & Evans, D.G. (1994)
- “A Method of Access to Computer Aided Software Engineering (CASE) Tools for Blind Software Engineers.” Computers for Handicapped Persons, 4th International Conference, ICCHP'94, Vienna, Austria, September 14-16, 1994, Proceedings. Zagler, W.L., Bushy, G. & Wagner, R. (Editors) Lecture Notes in Computer Science Vol. 860. Springer-Verlag, Berlin, Germany. pp321-328.
- Blenkhorn, P. & Evans, G. (2001)
- “Considerations for user interaction with talking screen readers.” Technology and Persons with Disabilities Conference (CSUN) 2001. Northridge, California, USA. Available online at http://www.csun.edu/cod/conf/2001/proceedings/0131blenkhorn.htm. Viewed December 2004.
- Blenkhorn, P., Evans, G., King, A., Crombie, D., Dijkstra, S., Gallagher, B., Magennis, M., Wood, J., Hagen, C., Schlieder, C., Horstmann, M., Ioannidis, G., O'Neill, A. & Petrie, H. (2003)
- “Providing blind people with access to technical diagrams.” Assistive Technology - Shaping the Future. Craddock, G.M., McCormack, L.P., Reilly, R.B., & Knops, H.T.P. (Editors) Proceedings of AAATE 2003 (7th European Conference for the Advancement of Assistive Technology in Europe) 31 August-3 September. IOS Press, Dublin, Ireland.
- Blogger (2004)
- “Blogger.” Available online at http://www.blogger.com/start. Viewed December 2004.
- Bobroskie, A. & Çelik, T. (2002)
- “HTML4 Test Suite Documentation.” Available online at http://www.w3.org/MarkUp/Test/HTML401/current/. Viewed December 2004.
- Borges, J.A., Morales, I. & Rodriguez, N.J. (1998)
- “Page Design Guidelines Developed through Usability Testing”. Human factors and Web development. Forsythe, C., Grose, E., & Ratner, J. (Editors.) Lawrence Erlbaum Associates, Mahwah, New Jersey, USA. pp137-152
- Bormans, G. & Engelen, J. (1998)
- “Automated production of a daily electronic newspaper: exploitation results.” Proceedings of the 3rd TIDE Congress, 1998. Helsinki, Finland. Available online at http://www.dinf.ne.jp/doc/english/Us_Eu/conf/tide98/157/bormans_engelen.html. Viewed December 2004.
- Bos, B., Çelik, T., Hickson, I., & Lie, H.W. (2004a)
- “Cascading Style Sheets, level 2 revision 1. CSS 2.1 Specification.” Available online at http://www.w3.org/TR/CSS21/. Viewed December 2004.
- Bos, B., Çelik, T., Hickson, I., & Lie, H.W. (2004b)
- “Appendix A. Aural Style Sheets.” Available online at http://www.w3.org/TR/CSS21/aural.html. Viewed November 2004.
- Bosher, P. & Brewer, J. (2001)
- “Alternative Web Browsing.” Available online at: http://www.w3.org/WAI/References/Browsing. Viewed November 2004
- Brewster, S.A., Wright, P.C. & Edwards, A.D.N. (1993)
- “An Evaluation of Earcons for Use in Auditory Human-Computer Interfaces.” CHI ’03 Proceedings of the conference on Human factors in computing systems. Ashlund, S., Mullet, K., Henderson, A., Hollnagel, E. & White, T. (Editors) Amsterdam, The Netherlands. ACM Press, New York, USA. pp222-227.
- Brewster, S. (1998)
- “Using Non-speech Sounds to Provide Navigation Cues.” ACM Transactions on Computer-Human Interaction, Vol. 5(2) 1998, pp 26 - 29.
- Brown, S.S. & Robinson, P. (2001)
- “A World Wide Web Mediator for Users with Low Vision.” Available online at http://www.ics.forth.gr/proj/at-hci/chi2001/files/brown.pdf. Viewed December 2004.
- Bruce, I.W., McKennell, A.C. & Walker, E.C. (1991)
- “Blind and partially sighted adults in Britain: The RNIB Survey.” Vol. 1. HMSO, London, 1991.
- Brusilovsky, P. (1996)
- “Methods and techniques of adaptive hypermedia.” User Modeling and User Adapted Interaction. Vol. 6 No.2-3. pp87-129.
- Bush, V. (1948)
- “How We May Think.” The Atlantic Monthly, July 1945. Available online at http://www.csi.uottawa.ca/~dduchier/misc/vbush/awmt.html. Viewed November 2004.
- Bussemakers, M.P. & de Haan, A. (2000)
- “When it Sounds like a Duck and it Looks like a Dog... Auditory icons vs. Earcons in Multimedia Environments.” The Seventh International Conference on Auditory Display (ICAD2000), Georgia Institute of Technology, Atlanta, Georgia, USA. Available online at: http://www.icad.org/websiteV2.0/Conferences/ICAD2000/PDFs/Bussemakers.pdf. Viewed August 2004.
- Buyukkokten, O., Garcia-Molina, H. & Paepcke, A. (2001)
- “Seeing the whole in parts: text summarization for web browsing on handheld devices.” Tenth International World Wide Web Conference, WWW10. Hong Kong, China, 1-5 May 2001. Available online at http://doi.acm.org/10.1145/371920.372178. Viewed October 2004.
- Caldwell, B., Chisholm, W., Vanderheiden, G. & White, J. (2004)
- “Web Content Accessibility Guidelines 2.0.” Available online at http://www.w3.org/WAI/GL/WCAG20/WD-WCAG20-20041116. Viewed December 2004.
- Campin, B., McCurdy, W., Brunet, L. & Siekierska, E. (2003)
- “SVG mapping for people with visual impairment.” SVGOPEN Conference 2003, Vancouver, Canada. Available online at http://www.svgopen.org/2003/papers/svgmappingforpeoplewithvisualimpairments/index.html. Viewed December 2004.
- Catledge, L.D. & Pitkow, J.E. (1995)
- “Characterizing Browsing Strategies in the World-Wide Web.” Computer Networks and ISDN Systems. Proceedings of the Third International World-Wide Web Conference. Vol. 27 No.6. Darmstadt, Germany. Elsevier B.V., New York, USA, 1995. pp1065-1073.
- Cavazos, E.A. & Miles, C.F. (1997)
- “Copyright on the WWW: Linking and Liability.” The Richmond Journal of Law and Technology. Vol. 4(2), Winter 1997.
- Challis, B.P. & Edwards, A.D.N. (2000)
- “Design principles for tactile interaction.” Lecture Notes in Computer Science Vol. 2058. Brewster, S. & Murray-Smith, R. (Editors) Springer, 2001. pp98-101.
- Chen, C. & Czerwinski, M. (1998)
- “From latent semantics to spatial hypertext – an integrated approach.” Proceedings of the ninth ACM conference on Hypertext and hypermedia : links, objects, time and space—structure in hypermedia systems: links, objects, time and space—structure in hypermedia systems. Pittsburgh, Pennsylvania , USA. ACM Press, New York, USA. pp77-86.
- Chen, C. & Rada, R. (1996)
- “Interacting with Hypertext: A Meta-Analysis of Experimental Studies.” Human-Computer Interaction, 11(2) October 2001, pp125-156.
- Chisholm, W., Ewers, N. & Novak, M., (1998)
- “Working towards accessible Java applications.” Technology and Persons with Disabilities Conference (CSUN) 1998. Northridge, California, USA. Available online at http://www.csun.edu/cod/conf/1998/proceedings/050.htm. Viewed December 2004.
- Chisholm, W., Vanderheiden, G., & Jacobs, I. (1999)
- “Web Content Accessibility Guidelines.” Available online at http://www.w3.org/TR/WCAG10/. Viewed August 2004.
- CITA (2004)
- “Section 508: The Road to Accessibility.” Available online at http://www.section508.gov/. Viewed February 2004.
- Connolly, D. & Masinter, L. (2000)
- “RFC-2854. The ‘text/html’ Media Type.” Available online at http://www.rfc-editor.org/rfc/rfc2854.txt. Viewed November 2004.
- Cote, J., Cote, M. & Harvey, C. (2004)
- “67,000 Tactile Graphics now available via Internet.” Technology and Persons with Disabilities Conference (CSUN) 2004. Northridge, California, USA. Available online at http://www.csun.edu/cod/conf/2004/proceedings/30.htm. Viewed December 2004.
- Bobbitt, J., Burggraf, D., Cox, S., Daisey, P., Herring, J., Johnson, S., Lake, R., Martell, R., Nakai, A., Portele, C., Trninic, M., Watson, P. & Whiteside, A. (2003)
- “OpenGIS Geography Markup Language (GML) Implementation Specification – Version 3.0.” Available online at http://www.opengeospatial.org/specs/?page=specs. Viewed December 2004.
- Cockburn, A., Greenburg, S., Jones, S., McKenzie, S. & Moyle, M. (2003)
- “Improving web page revisitation: analysis, design, and evaluation.” IT & Society Vol. 3(1), Winter 2003. pp159-183.
- Crispien, K., Würz, W. & Weber, G. (1994)
- “Using Spatial Audio for the Enhanced Presentation of Synthesised Speech within Screen-Readers for Blind Computer Users.” Computers for Handicapped Persons, 4th International Conference, ICCHP'94, Vienna, Austria, September 14-16, 1994, Proceedings. Zagler, W.L., Bushy, G. & Wagner, R. (Editors) Lecture Notes in Computer Science Vol. 860. Springer-Verlag, Berlin, Germany. pp144-153.
- Crunchy Technologies (2004)
- “Crunchy Technologies Accessibility Solutions.” Available online at http://www.crunchy.com/tools/index.html. Viewed December 2004.
- Cynthia Says (2004)
- “Cynthia Says Portal.” Available online at http://www.cynthiasays.com/. Viewed October 2004.
- Delo, 2004
- Newspaper website. Available online at http://www.delo.si/. Viewed November 2004.
- De Witt, J.C. & Hakkinen, M.T. (1998)
- “Surfing the web with pwWebSpeak.” Technology and Persons with Disabilities Conference (CSUN) 1998. Northridge, California, USA. Available online at http://www.csun.edu/cod/conf/1998/proceedings/159.htm. Viewed December 2004.
- Dia (2004)
- “Dia a drawing programme.” Available online at http://www.gnome.org/projects/dia/. Viewed December 2004.
- Disability Rights Commission (2004)
- “The Web: Access and Inclusion for Disabled People.” Available online from http://www.drc-gb.org/publicationsandreports/2.pdf. Viewed December 2004.
- Donker, H., Klante, P., & Gorny, P. (2002)
- “The Design of Auditory User Interfaces for Blind Users.”Proceedings of the Second Nordic Conference on Human-Computer Interaction. NordiCHI, Tradition and Transcendence. Bertelsen, O.W., Bodker, S. & Kuutti, K (Editors)., October 19-23, 2002, Aarhus, Denmark. ACM Press, New York, USA, pp 149-155.
- Drullman, R. & Bronkhorst, A.W. (1999)
- "Multichannel speech intelligibility and talker recognition using monoaural, binaural and three-dimensional auditory presentation". Journal of the Acoustical Society of America. Vol. 107, 2000, pp 2224-2235.
- Dufresne, A., Martial, O., Ramstein, C. & Mabilleau, P. (1996)
- “Sound, Space, and Metaphor: Multimodal Access to Windows for Blind Users.” The Third International Conference on Auditory Display (ICAD96), Palo Alto, California, USA. Available online at http://www.icad.org/websiteV2.0/Conferences/ICAD96/proc96/dufresne1.htm. Viewed December 2004.
- Ebina, T., Igi, S. & Miyake, T. (2000)
- "Fast Web by Using Updated Content Extraction and a Bookmark Facility." Assets '00: Proceedings of the fourth international ACM conference on Assistive technologies. Tremaine, M., Cole, E. & Mynatt, E. (Editors) Arlington, Virginia, USA. ACM Press, New York, USA, 2000. pp64-71.
- ECMA (1999)
- “ECMAScript Language Specification. 3rd Edition” Available online at http://www.ecma-international.org/publications/files/ecma-st/ECMA-262.pdf. Viewed December 2004.
- Edwards, W.K., Mynatt, E.D. & Stockton, K. (1995)
- “Access to graphical interfaces for blind users.” Interactions, Vol. 2(1), January 1995, pp54-67.
- e-Government (2004)
- “Illustrated web handbook for web management teams.” Section 6.6 “Web page navigation.” Available online at http://e-government.cabinetoffice.gov.uk/Resources/WebGuidelines/fs/en. Viewed August 2004.
- Fairweather, P.G., Hanson, V.L., Detweiler, S.R. & Schwerdtfeger, R.S. (2002)
- “From Assistive Technology to a Web Accessibility Service”, Assets '02: Proceedings of the fifth international ACM conference on Assistive technologies. Hanson, V.L. & Jacko, J.A. (Chairs) Edinburgh, UK. ACM Press, New York, USA, 2002. pp4-8.
- Fanstone, J. (1995)
- “A Campus GIS for the Visually Impaired.” GIS Europe Vol. 4(3) pp44-45.
- Fielding, R., Irvine, U.C., Gettys, J., Mogul, J., Frystyk, H. Masinter, L., Leach, P. & Berners-Lee, T. (1999)
- “RFC-2616 Hypertext Transfer Protocol 1.1.” Available online at ftp://ftp.isi.edu/in-notes/rfc2616.txt. Viewed November 2004.
- Ferraiolo, J., Fujisawa, J., Jackson, D. (2003)
- “Scalable Vector Graphics (SVG) 1.1. Specification.” Available online at http://www.w3.org/TR/SVG11/. Viewed December 2004.
- Filepp, R., Challenger, J. & Rosu, D. (2002)
- “Improving the accessibility of aurally rendered HTML tables.” Assets '02: Proceedings of the fifth international ACM conference on Assistive technologies. Hanson, V.L. & Jacko, J.A. (Chairs) Edinburgh, UK. ACM Press, New York, USA, 2002. pp9-16.
- Fonix (2004)
- “SpeakThis.” Available online at http://www.speakthis.com/highlights.cfm?highlight=aural&name=Aural%20Style%20Sheet%20Support. Viewed December 2004.
- Freedom Scientific (2004)
- “JAWS for Windows.” Available online at http://www.freedomscientific.com/fs_products/software_jaws.asp. Viewed August 2004.
- Fritz, J.P., Way, T.P. & Barner, K.E. (1996)
- “Haptic Representation of Scientific Data for Visually Impaired or Blind Persons.” Technology and Persons with Disabilities Conference (CSUN) 1996. Northridge, California, USA. Available online at: http://www.ee.udel.edu/InfoAccess/Publications/fritz_way_barner_CSUN_96.ps. Viewed December 2004.
- Gallagher, B. & Frasch, W. (1998)
- “Tactile Acoustic Computer Interaction System (TACIS): A new type of Graphic Access for the Blind.” Proceedings of the 3rd TIDE Congress, 1998. Helsinki, Finland. Available online at http://www.stakes.fi/tidecong/633tacis.htm. Viewed December 2004.
- Gardner, J.A., Lundquist, R. & Sahyun, S. (1998)
- “TRIANGLE: A Tri-Modal Access Program for Reading, Writing and Doing Math.” Technology and Persons with Disabilities Conference (CSUN) 1998. Northridge, California, USA. Available online at http://www.csun.edu/cod/conf/1998/proceedings/csun98_104.htm. Viewed December 2004.
- Gardner, J.A., & Bulatov, V. (2001)
- “Smart figures, SVG, and accessible web graphics.” Technology and Persons with Disabilities Conference (CSUN) 2001. Northridge, California, USA. Available online at: http://www.csun.edu/cod/conf/2001/proceedings/0103gardner.htm. Viewed December 2004.
- Gardner, J.A. & Bulatov, V. (2004)
- “Complete access to all paper and computer forms, tables, and charts.” Technology and Persons with Disabilities Conference (CSUN) 2004. Northridge, California, USA. Available online at http://www.csun.edu/cod/conf/2004/proceedings/162.htm. Viewed December 2004.
- Gaver, W., (1986)
- “Auditory Icons: Using Sound in Computer Interfaces.” Human Computer Interaction, Vol. 2(1) pp167-177.
- Gentleware (2004)
- “Poseidon for UML.” Available online at: http://www.gentleware.com/company/CompanyProductOverview.pdf. Viewed August 2004.
- Geocities (2004)
- “Yahoo! GeoCities.” Available online at http://geocities.yahoo.com/. Viewed September 2004.
- Ghostscript (2004)
- “Ghostscript, Ghostview and Gsview.” Available online at http://www.cs.wisc.edu/~ghost/. Viewed August 2004.
- Goble, C., Harper, S. & Stevens, R. (2000)
- “The Travails of Visually Impaired Web Travellers.” Conference on Hypertext and Hypermedia. Proceedings of the eleventh ACM on Hypertext and hypermedia. San Antonio, Texas, USA. ACM Press, New York, USA, 2000. pp1-10.
- Golledge, R.G. (1993)
- “Geography and the disabled: a survey with special reference to vision impaired and blind populations.” Transactions of the Institute of British Geographers. Vol. 18. pp63-85.
- Google (2004a)
- “Web APIs.” Available online at http://www.google.com/apis/. Viewed August 2004.
- Google (2004b)
- “Google information for webmasters.” Available at http://www.google.com/webmasters/seo.html. Viewed September 2004.
- Google (2004b)
- “About Gmail.” Available online at http://gmail.google.com/gmail/help/about.html. Viewed September 2004.
- Google (2004d)
- “Google.” Available online at http://www.google.com. Viewed November 2004.
- GoRank (2004)
- “Google keyword density analysis.” Available online at http://www.gorank.com/research/01072004_Google_Density_Report.php. Viewed December 2004.
- Gorny, P. (2000)
- “Typographic semantics of webpages accessible for visually impaired users.” Computers Helping People with Special Needs, ICCHP 2000. , Karlsruhr, Germany. Vollmar, R. & Wagner, R. (Editors) Österreichische Computer Gesellschaft, Vienna, Austria, 2000. pp 251 - 257.
- GPL (2004)
- “GNU General Public Licence – GNU Project – Free Software Foundation (FSF)..” Available online at http://www.gnu.org/copyleft/gpl.html. Viewed August 2004.
- Green, T.R.G. & Petre, M. (1992)
- “When Visual Programs are Harder to Read than Textual Programs.” Human-Computer Interaction: Tasks and Organisation, Proceedings of the 6th European Conference Cognitive Ergonomics. van der Veer, G.C., Tauber, M.J., Bagnarola, S. & Antavolits, M. (Editors) Balatonfured, Hungary, 1992. CUD, Rome, 1992. Available online at http://citeseer.ist.psu.edu/green92when.html. Viewed December 2004.
- Green, T.R.G & Petre, M. (1996)
- “Usability analysis of visual programming environments: a cognitive dimensions framework.” Journal of Visual Languages and Computing, 1996, Vol. 7 pp131-174.
- Guardian (2004)
- “Stay up-to-date with our web feeds.” Available online at http://www.guardian.co.uk/webfeeds. Viewed December 2004.
- Hakkinen, M.T. & De Witt, J.C. (1997)
- “An accessible web browser: the application of first order design principles in PwWebSpeak.” Technology and Persons with Disabilities Conference (CSUN) 1997. Northridge, California, USA. Available online at http://www.dinf.ne.jp/doc/english/Us_Eu/conf/csun_97/csun97_049.htm. Viewed December 2004.
- Hall, R.H. & Hanna, P. (2004)
- “The Impact of Web Page Text-Background Color Combinations on Readability, Retention, Aesthetics, and Behavioral Intention.” Behaviour & Information Technology. Vol. 23 No.3, May/June 2004. pp183-195.
- Hanson, V.L. (2001)
- “Web access for elderly citizens.” WUAUC'01: Proceedings of the 2001 EC/NSF workshop on Universal accessibility of ubiquitous computing. Alcácer do Sal, Portugal. ACM Press, New York, USA. pp14-18.
- Hanson, V.L. & Richards, J.T. (2004)
- “A web accessibility service: update and findings.” Accessibility and Computing Issue 77-78 September 2003 – January 2004. pp169-176.
- Hawley, M.L., Litovsky, R.Y. & Colburn, H.S. (1999)
- “Speech intelligibility and localisation in a multi-source environment.” Journal of the Acoustical Society of America. Vol. 105, 1999, pp3436-3448.
- Hermish (2004)
- “Accessibility checking tool.” Available online at http://www.hermish.com/check_access.cfm. Viewed October 2004.
- HiSoftware (2004)
- HiSoftware WebSite Quality Testing Solutions website, online at http://www.hisoftware.com/access/
- Horsfall, B. (1997)
- “Tactile Maps: New Materials and Improved Designs.” Journal of Visual Impairment and Blindness. January - February 1997, pp61-65.
- Howes, E.L. (2004)
- “IE-SPYAD: Restricted Sites List for Internet Explorer.” Available online at https://netfiles.uiuc.edu/ehowes/www/resource.htm. Viewed November 2004.
- Huang, A.W. & Sundaresan, N. (2000)
- “Aurora: A conceptual model for web-content adaptation to support the universal usability of web-based services.” CUU '00: Proceedings on the 2000 conference on Universal Usability. Arlington, Virginia, USA. ACM Press, New York, USA, 2000. pp156-163.
- Hyatt, D., Goodger, B., Hickson, I. & Waterson, C. (2001)
- “XML User Interface Language (XUL) 1.0.” Available online at http://www.mozilla.org/projects/xul/xul.html. Viewed November 2004.
- IBM (2004a)
- “IBM Home Page Reader 3.0.” Available online at http://www-306.ibm.com/able/solution_offerings/hpr.html. Viewed December 2004.
- IBM (2004)
- “IBM Rational Rose XDE Developer: Model-driven development with UML support.” Available online at http://www.pts.com/rosexde.cfm. Viewed August 2004.
- IDC (2004)
- “The Rise and Rise of Broadband.” Available online at http://www.idc.com/getdoc.jsp?containerId=pr2003_12_16_154842. Viewed September 2004.
- ID Games (2004)
- “Final DOOM.” Available online at: http://www.idsoftware.com/games/doom/doom-final/. Viewed August 2004.
- ISO (1986)
- “Information processing–Text and office systems–Standard Generalized Markup Language (SGML)” International Organization for Standardization, ISO 8879, 1986.
- Ivory, M.Y. & Hearst, M.A. (2002)
- “Statistical Profiles of Highly-Rated Web Site Interfaces.” Proceedings of the Conference on Human Factors in Computing Systems, CHI Letters Vol. 4, Minneapolis, Minnesota, USA. pp367-374,
- Ivory, M.Y, Mankoff, J. & Le, A. (2003)
- “Using automated tools to improve website usage by users with diverse abilities.” IT & Society, Vol. 1(3), 2003, pp195-236
- Jacobs, I., Gunderson, J. & Hansen, E. (2002)
- “User Agent Accessibility Guidelines 1.0.” Available online at http://www.w3.org/TR/UAAG10/. Viewed December 2004.
- Jackson-Sanborn, E., Odess-Harnish, K. & Warren, N. (2001)
- “Website Accessibility: A Study of ADA Compliance.” Available online at http://ils.unc.edu/ils/research/reports/accessibility.pdf. Viewed April 2004.
- James, F. (1997)
- “AHA: Audio HTML Access.” Sixth International World Wide Web Conference, Santa Clara, California, USA , April 1997. Available online at http://www.ra.ethz.ch/CDstore/www6/Technical/Paper296/Paper296.html. Viewed December 2004.
- JD Power (2004)
- “More Than One-Half of Residential Internet SubscribersUse Instant Messaging, and Use It Frequently.” Available online at http://www.jdpa.com/pdf/2004135.pdf. Viewed December 2004.
- Johansson, A.J. & Linde, J. (1998)
- “Using Simple Force Feedback Mechanisms to Visualize Structures by Haptics.” Second Swedish Symposium of MultiModal Communications, Lund University, Lund, Sweden, 16-17 October 1998. Available online at http://www.tde.lth.se/home/ajn/publications/sssmmc.pdf. Viewed December 2004.
- Johansson, A.J. & Linde, J. (1999)
- “Using Simple Force Feedback Mechanisms as Haptic Visualization Tools.” Sixteenth IEEE Instrumentation and Measurement Technology Conference IMTC/99, Venice, Italy, 24-26 May 1999. Available online at http://www.tde.lth.se/home/ajn/publications/IMTC99.pdf. Viewed December 2004.
- Johansson, R. (2004)
- “Who framed the web: frames and usability.” Available online at http://www.456bereastreet.com/archive/200411/who_framed_the_web_frames_and_usability/. Viewed December 2004.
- Kaasinen, E., Aaltonen, M., Kolari, J., Melakoski, S. & Laakko, T. (2000)
- “Two Approaches to Bringing Internet Services to WAP Devices.” Proceedings of 9 World-Wide-Web Conference WWW'9. Amsterdam, 15-19 May 2000, pp. 231-246. Available online at http://www9.org/w9cdrom/228/228.html. Viewed December 2004.
- Kamel, H.M., Roth, P. & Sinha, R.R. (2001)
- “Graphics and User’s Exploration via Simple Sonics (GUESS): Providing Interrelational Representation of Objects in a Non-visual Environment.” The Seventh International Conference on Auditory Display (ICAD2001). Espoo, Finland. Available online at http://www.acoustics.hut.fi/icad2001/proceedings/papers/kamel.pdf. Viewed December 2004.
- Kawai, Y. & Tomita, F. (2001)
- “A Support System for Visually Impaired Persons Using Acoustic Interface – Recognition of 3-D Spatial Information.” Usability evaluation and interface design: Cognitive engineering, intelligent agents and virtual reality. Smith, M.J., Salvendy, G., Harris, D., & Koubek, R. J. (Editors) 2001. Proceedings of HCI International 2001. Vol. 1. Lawrence Erlbaum Associates, Mahwah, New Jersey, USA. Pp203-207.
- Kennedy, J.M. (1982)
- “Haptic pictures.” Tactual Perception. Schiff, W. & Foulkes, E. (Editors) Cambridge University Press, Cambridge, UK, 1982, pp 305 - 333.
- Kennel, A., Perrochon, L., & Darvishi, A. (1996)
- “WAB: World-Wide Web Access for Blind And Visually Impaired Computer Users.” New Technologies in the Education of the Visually Handicapped. ACM SIGCAPH Bulletin 55, June 1996. pp10-15.
- Kieninger, T.G. (1996)
- “The ‘Growing Up’ of HyperBraille – an office workspace for blind people.” UIST '96: Proceedings of the 9th annual ACM symposium on User interface software and technology: Assets ‘96. ACM Press, New York, USA. pp67-73.
- King, A., Blenkhorn, P., Crombie, D., Dijkstra, S., Evans, G. & Wood, J. (2004)
- “Presenting UML Software Engineering Diagrams to Blind People.” Computers Helping People with Special Needs, 9th International Conference, ICCHP 2004, Paris, France, July 7-9, Proceedings. Klaus, J., Miesenberger, K., Burger, D. & Zagler, W.L. (Editors) Lecture Notes in Computer Science Vol. 3118. pp522-529
- Kitchin, R.M. & Jacobson, R.D. (1997)
- “Techniques to Collect and Analyze the Cognitive Map Knowledge of Persons with Visual Impairment or Blindness: Issues of Validity.” Journal of Visual Impairment and Blindness, July-August 1997, pp 360 - 376.
- Klatt, D.H. (1987)
- “Review of text-to-speech conversion for English.” Journal of the Acoustical Society of America. Vol. 82(3), September 1987, pp737-793.
- Klatzky, R.L., Lederman, S. & Reed, C. (1987)
- “There's more to touch than meets the eye: the salience of object attributes for haptics with and without vision.” Journal of Experimental Psychology. Vol. 116(4), 1987, pp 356-369.
- Koedinger, K.R. (1992)
- “Emergent Properties and Structural Constraints: Advantages of Diagrammatic Representations for Reasoning and Learning.” AAAI Spring Symposium Technical Report SS-92-02: Reasoning with Diagrammatic Representations. Chandrasekaran, B. & Simon, H. (Editors). AAAI Press , Menlo Park, California, USA, 1992.
- Kulpa, Z. (1994)
- “Diagrammatic Representation and Reasoning.” Machine Graphics & Vision. Vol. 3 Nos. 1/2, 1994, pp77-103.
- Kurze, M. (1998)
- “TGuide: A Guidance System for Tactile Image Exploration.” Assets '98: Proceedings of the third international ACM conference on Assistive technologies. Blattner, M.M. & Karshmer, A.I. (Editors) Marina del Rey, California, USA. ACM Press, New York, USA, 1998. pp85-91.
- Larkin, J.H. & Simon, H.A. (1987)
- “Why a diagram is (sometimes) worth ten thousand words.” Cognitive Science. Vol. 11, 1987, pp65-99.
- Lawrence, S. & Giles, C.L. (1999)
- “Accessibility of information on the web.” Nature. Vol. 400, 1999, pp107-109.
- Lenhart, A., Horrigan, J. & Fallows, D. (2004)
- “Content Creation Online.” Available online at http://www.pewinternet.org/pdfs/PIP_Content_Creation_Report.pdf. Viewed December 2004.
- Levi, J.M. & Amick, N.S. (1982)
- “Tangible graphics: producers’ views.” Tactual Perception. Schiff, W. & Foulkes, E. (Editors). Cambridge University Press, Cambridge, UK, 1982, pp 417 - 429.
- Links (2004)
- “Links. The WWW Text Browser.” Available online at http://links.sourceforge.net/. Viewed November 2004.
- Lockyer, S., Creaser, C. & Davies, J.E. (2004)
- “Availability of Accessible Publications.” Library and Information Statistics Unit, Loughborough University, UK, 2004.
- Lorho, G., Marila, J. & Hiipakka, J. (2001)
- “Feasibility of multiple non-speech sounds presentation using headphones.” The Seventh International Conference on Auditory Display (ICAD2001). Espoo, Finland. Available online at http://www.acoustics.hut.fi/icad2001/proceedings/papers/lorho.pdf. Viewed December 2004.
- Loveday, Robert (1969)
- “Chapter 8: The use of Χ2 in testing contingency tables” in “Statistics.” Cambridge University Press, Cambridge, UK, 1969.
- Ludwig, L., Pincever, N. & Cohen, M. (1990)
- “Extending the notion of a window system to audio.” Computer. Vol. 23, 1990, pp 66 - 72.
- Lynx (2004)
- “Lynx web browser.” Available online at http://lynx.browser.org/. Viewed November 2004.
- MacKenzie, I.S. (1995)
- “Input devices and interaction techniques for advanced computing.” Virtual Environments and Advanced Interface Design. Barfield, W. & Furness III, T.A. (Editors) Oxford University Press, Oxford, UK. pp437-470.
- Macromedia (2004a)
- “Accessibility and Macromedia Flash Player 7..” Available online at http://www.macromedia.com/macromedia/accessibility/features/flash/player.html. Viewed November 2004.
- Macromedia (2004b)
- “Macromedia Flash Player 7.” Available online at http://www.macromedia.com/software/flashplayer/. Viewed August 2004.
- Macromedia (2004c)
- “Macromedia Shockwave Player.” Available online at http://www.macromedia.com/software/shockwaveplayer/. Viewed December 2004.
- Mann, D., Marriott, J. & Vale, D. (2003)
- “The Right to Read.” Royal National Institute for the Blind, London, UK, 2003.
- Mark, W.R., Randolph, S.C., Finch, M., Van Verth, J.M. & Taylor, R.M. (1995)
- “Adding force feedback to graphics systems: issues and solutions.” Computer Graphics Vol. 30 1995 pp447-452.
- Marshall, C. & Shipman, F.M. (1993)
- “Searching for the missing link: Discovering implicit structure in spatial hypertext.” Proceedings of the fifth ACM conference on Hypertext. Seattle, Washington, USA. ACM Press, New York, USA. pp. 217-230.
- Massironi, M. (2002)
- “The Psychology of Graphic Images: Seeing, Drawing, Communicating.” Lawrence Erlbaum Associates, Mahwah, New Jersey, USA, 2002.
- Maucher, T., Schemmel, J. & Meier, K. (2000)
- “The Heidelberg Tactile Vision Substitution System” Computers Helping People with Special Needs, ICCHP 2000. Karlsruhr, Germany. Vollmar, R. & Wagner, R. (Editors) Österreichische Computer Gesellschaft, Vienna, Austria, 2000.
- May, M. (2003)
- “Inaccessibility of Visually-Oriented Robot Tests.” Available online at http://www.w3.org/TR/turingtest/. Viewed November 2004.
- McCann, W.R. (2001)
- “Tools for the Blind Music Professional, Student and Hobbyist: A Review of Technologies that Work!” Technology and Persons with Disabilities Conference (CSUN) 2001. Northridge, California, USA. Available online at http://www.csun.edu/cod/conf/2001/proceedings/0257mccann.htm. Viewed December 2004.
- McCathieNevile, C. & Koivunen, M. (2000)
- “Accessibility features of SVG.” Available online at http://www.w3.org/TR/2000/NOTE-SVG-access-20000807. Viewed July 2004.
- McCue, A. (2003)
- “Eye movement tracking technology exposes poor web design.” Available online at www.silicon.com/networks/ webwatch/0,39024667,39117046,00.htm. Viewed December 2004.
- MCU (2003)
- “Design versus accessibility?” Available online at http://www.mcu.org.uk/book/designvaccess.html. Viewed October 2004.
- Meijer, P.B.L. (1992)
- “An experimental system for auditory image representations.” IEEE Transactions on Biomedical Engineering. Vol. 39(2) February 1992, pp112-121.
- Microsoft (2002)
- “Guidelines for Keyboard User Interface Design.” Available online at msdn.microsoft.com/library/ en-us/dnacc/html/ATG_KeyboardShortcuts.asp. Viewed August 2004.
- Microsoft (2004a)
- “Microsoft SideWinder Home.” Available online at http://www.microsoft.com/hardware/sidewinder/default_noflash.asp. Viewed August 2004.
- Microsoft (2004b)
- “DirectX.” Available online at msdn.microsoft.com/directx/. Viewed August 2004.
- Microsoft (2004c)
- “VBScript.” Available online at http://msdn.microsoft.com/scripting/vbscript/default.htm. Viewed December 2004.
- Microsoft (2004d)
- “About the DTHML Object Model.” Available online at msdn.microsoft.com/workshop/author/om/doc_object.asp. Viewed August 2004.
- Microsoft (2004e)
- “Previous Versions of Visual Basic.” Available online at http://msdn.microsoft.com/vbasic/previous/vb6/default.aspx. Viewed August 2004.
- Microsoft (2004f)
- “Accessibility.” Available online at http://msdn.microsoft.com/at/. Viewed August 2004.
- Microsoft (2004g)
- “ActiveX Controls.” Available online at www.microsoft.com/com/tech/ActiveX.asp. Viewed August 2004.
- Microsoft (2004h)
- “Internet Explorer 6 Service Pack 1.” Available online at Reference - Microsoft 2004h. Viewed August 2004.
- Microsoft (2004i)
- “Automating Word Using the Word Object Model.” Available online at msdn.microsoft.com/library/en-us/dv_wrcore/ html/wroriautomatingwordusingwordobjectmodel.asp. Viewed August 2004.
- Microsoft (2004j)
- “Microsoft Windows Media – Home.” Available online at www.microsoft.com/windows/windowsmedia/. Viewed August 2004.
- Microsoft (2004k)
- “Communicating Control Readiness (Internet Explorer – COM).” Available online at msdn.microsoft.com/workshop/ components/com/ctl_readiness.asp. Viewed September 2004.
- Microsoft (2004l)
- “Introduction to Regular Expressions.” Available online at msdn.microsoft.com/library/en-us/script56/ html/reconintroductiontoregularexpressions.asp. Viewed October 2004.
- Microsoft (2004m)
- “‘Longhorn’ Markup Language (code-named ‘XAML’) Overview.” Available online at http://longhorn.msdn.microsoft.com/lhsdk/core/overviews/about%20xaml.aspx. Viewed November 2004.
- Mihelic, F., Pavesic, N., Dobrisek, S., Gros, J., Vesnicer, B. & Zibert, J. (2002)
- “Homer - A Small Self Voicing Web Browser for Blind People.” Available online at http://luks.fe.uni-lj.si/HPVWI/final/. Viewed December 2004.
- Millar, S. (1994)
- “Understanding and representing space: theory and evidence from studies with blind and sighted children.” Oxford University Press, Oxford, UK. 1994.
- Morkes, J. & Nielsen, J. (1997)
- “Concise, SCANNABLE, and Objective: How to Write for the Web.” Available online at http://www.useit.com/papers/webwriting/writing.html. Viewed December 2004.
- Morley, S. (1998)
- “Digital talking books on a PC: a usability evaluation of the prototype DAISY playback software.” Assets '98: Proceedings of the third international ACM conference on Assistive technologies. Blattner, M.M. & Karshmer, A.I. (Editors) Marina del Rey, California, USA. ACM Press, New York, USA, 1998. pp157-164.
- Morley, S., Petrie, H., O'Neill, A. & McNally, P. (1998a)
- “Auditory Navigation in Hyperspace: Design and Evaluation of a Non-Visual Hypermedia System for Blind Users.” Assets '98: Proceedings of the third international ACM conference on Assistive technologies. Blattner, M.M. & Karshmer, A.I. (Editors) Marina del Rey, California, USA. ACM Press, New York, USA, 1998. pp100-107.
- Morley, S., Petrie, H., O'Neill, A. & McNally, P. (1998b)
- “The use of non-speech sounds in a hypermedia interface for blind users.” Computers Helping People with Special Needs, Sixth International Conference, ICCHP’98 Vienna, Austria & Budapest, Hungary. Edwards, A.D.N., Arató, A., & Zagler, W.L. (Editors.) Austrian Computer Society Book Series Vol. 118, Vienna, Austria, 1998.. pp205-214.
- Mozdev (2004)
- “Sage.” Available online at http://sage.mozdev.org/. Viewed December 2004.
- Mozilla (2004)
- “Firefox.” Available online at: http://www.mozilla.org/products/firefox/. Viewed November 2004.
- Muffin (2004)
- “World Wide Web Filtering System.” Available online at http://muffin.doit.org/. Viewed August 2004.
- Mukherjea, S. & Foley, J.D. (1995)
- “Visualizing the World-Wide Web with the Navigational View Builder.” Computer Networks and ISDN Systems. Proceedings of the Third International World-Wide Web Conference. Vol. 27 No.6. Darmstadt, Germany. Elsevier B.V., New York, USA, 1995. pp1075-1087.
- Music Publishers Association (2001)
- “Copyright and visually impaired people.” Available online at http://www.mpaonline.org.uk/visually_impaired.html. Viewed December 2004.
- Mynatt, E.D. & Edwards, W.K. (1992)
- “Mapping GUIs to auditory interfaces.” Symposium on User Interface Software and Technology archive. Proceedings of the 5th annual ACM symposium on User interface software and technology. ACM Press, New York.
- Mynatt, E.D. & Weber, G. (1994)
- “Nonvisual Presentation of Graphical User Interfaces: Contrasting Two Approaches.” CHI ‘94: Proceedings of the SIGCHI conference on Human factors in computing systems. Adelson, B., Dumais, S. & Olson, J. (Editors) Boston, Massachusetts, USA. ACM Press, New York, USA, 1994. pp166-172
- Nagao, K., Shirai, Y. & Squire, K. (2001)
- “Semantic annotation and transcoding: web content more accessible.” IEEE Multimedia. Vol. 8(2) April-June 2001. pp68-81.
- NASA (2004)
- “Iliad – An Offline Search Engine.” Available online at http://prime.jsc.nasa.gov/iliad/iliadtxt.html. Viewed November 2004.
- National Information Library Service (2004)
- “Web Accessibility Toolbar.” Available online at http://www.nils.org.au/ais/web/resources/toolbar/index.html. Viewed December 2004.
- National Centre for Tactile Diagrams (2004)
- “Swell Paper.” Available online at http://www.nctd.org.uk/MakingTG/swell.asp. Viewed December 2004.
- Nentwich, C., Emmerich, W., Finkelstein, A. & Zisman, A. (2000)
- “BOX: Browsing objects in XML.” SOFTWARE PRACTICE AND EXPERIENCE. 2000, Vol. 30, pp1661-1676.
- Netscape (2000)
- “Core JavaScript Guide.” Available online at http:// devedge.netscape.com/library/ manuals/2000/javascript/1.5/guide/. Viewed December 2004.
- Niederst, J. (2001)
- “Web design in a nutshell.” Chapter 2.3. Available online at http://skaiste.elekta.lt/Books/O'Reilly/Bookshelfs/books/webdesign/wdesign/ch02_03.htm. Viewed October 2004.
- Nielsen, J. (1996)
- “Why Frames Suck (Most of the Time).” Available online at http://www.useit.com/alertbox/9612.html. December 1996. Viewed August 2004.
- Nielsen, J. (1997)
- “Search and You May Find.” Available online at http://www.useit.com/alertbox/9707b.html. Viewed August 2004.
- Nielsen, J. (2002)
- “Site Map Usability.” Available online at http://www.useit.com/alertbox/20020106.html. Viewed November 2004.
- Nielsen, J. (2003a)
- “The Ten Most Violated Homepage Design Guidelines.” Available online at http://www.useit.com/alertbox/20031110.html. Viewed December 2004.
- Nielsen, J. (2003b)
- “Information Foraging: Why Google Makes People Leave Your Site Faster.” Available online at http://www.useit.com/alertbox/20030630.html. Viewed November 2004.
- NIST (2002)
- “WebSAT.” National Institute of Standards and Technology. Available online at http://zing.ncsl.nist.gov/WebTools/WebSAT/overview.html. Viewed December 2004.
- Olston, C. & Chi, E.H. (2003)
- “ScentTrails: integrating browsing and searching on the web.” ACM Transactions on Computer-Human Interaction. Vol. 10 No.3 (September 2003) pp177-197
- OMG (2004a)
- “Introduction to OMG's Unified Modeling Language (UML).” Available online at: http://www.omg.org/gettingstarted/what_is_uml.htm. Viewed August 2004.
- OMG (2004b)
- “OMB Unified Modeling Language Specification. Version 1.5.” Available online at http://www.omg.org/technology/documents/formal/uml.htm. Viewed December 2004.
- OMG (2004c)
- “XML Metadata Interchange.” Available online at: http://www.omg.org/docs/omg/99-04-04.pdf. Viewed August 2004.
- OneStat (2004a)
- “Microsoft's Internet Explorer global usage share is 93.9 percent according to OneStat.com.” Available online at http://www.onestat.com/html/aboutus_pressbox30.html. Viewed August 2004.
- OneStat (2004b)
- “Most common screen resolution is 1024 x 768 for exploring the internet according to OneStat.com.” Available online at http://www.thecounter.com/stats/2004/March/res.php. Viewed August 2004.
- Oogane, T. & Asakawa, C. (1998)
- “An interactive method for accessing tables in HTML.” Assets '98: Proceedings of the third international ACM conference on Assistive technologies. Blattner, M.M. & Karshmer, A.I. (Editors) Marina del Rey, California, USA. ACM Press, New York, USA, 1998. pp126-128.
- OpenOffice (2004)
- “api: Text Documents.” Available online at http://api.openoffice.org/docs/DevelopersGuide/Text/Text.htm. Viewed August 2004.
- Opera (2004a)
- “Authoring for Small-Screen Rendering.” Available online at http://www.opera.com/products/mobile/dev/html/. Viewed November 2004.
- Opera (2004b)
- “Opera for Windows.” Available online at http://www.opera.com/products/desktop/. Viewed November 2004.
- Opera (2004c)
- “Opera’s Small-Screen Rendering.” Available online at http://www.opera.com/products/mobile/smallscreen/. Viewed November 2004.
- Oriola, B., Vigouroux, N., Truillet, P. & Lacan, F. (1998)
- “An observation method of Internet electronic documents accessibility.” Proceedings of the 3rd TIDE Congress, 1998, Helsinki, Finland. Available online at http://www.dinf.ne.jp/doc/english/Us_Eu/conf/tide98/157/bormans_engelen.html. Viewed December 2004.
- Parkes, D. (1988)
- “NOMAD: An audio-tactile tool for the acquisition, use and management of spatially-distributed information by partially-sighted and blind persons.” Proceedings of the Second International Symposium on Maps and Graphics for Visually-Handicapped People. A.F. & Dodds, A.G. (Editors) Kings College, University of London, London, UK, 1988. Tatham, London, UK.. pp 24-29.
- Parkes, D. (1994)
- “Audio tactile systems for designing and learning complex environments as a vision impaired person: Static and dynamic spatial information access.” Proceedings for ASET's 1994 biennial conference. Steele, J. & Hedberg, J.G. (Editors) Learning Environment Technology. Selected papers from LETA 94, Adelaide, South Australia, 25-28 September. AJET Publications, Canberra, Australia.
- Parkes, D. (1998)
- “Tactile Audio Tools for Graphicacy and Mobility: A circle is either a circle or it is not a circle.” British Journal of Visual Impairment, Vol. 16(3), 1998, pp99-104.
- Passini, R., Proulx, G. & Rainville, C. (1990)
- “The spatio-cognitive abilities of the visually impaired population.” Environment and Behaviour. Vol. 20. pp227-252.
- PC Review (2004)
- “Spyware and Adware Removal.” Available online at http://www.pcreview.co.uk/article-7086.php. Viewed November 2004.
- PDFTOHTML (2004)
- “PDFTOHTML conversion program.” Available online at http://pdftohtml.sourceforge.net/. Viewed August 2004.
- Pearson, R. & van Schaik, P. (2003)
- “The effect of spatial layout of and link colour in web pages on performance in a visual search task and an interactive search task.” International Journal of Human-Computer Studies. Vol. 59(3) September 2003. pp327-353.
- Petrie, H., Obee, J., Blenkhorn, P. & Evans, G. (1996)
- “User-based evaluation of a system for access to computer aided software engineering (CASE) tools for blind software engineers.” Interdisciplinary aspects on computers helping people with special needs, ICCHP’96 Linz, Austria. Klaus, J., Auff, E., Kremser, W., & Zagler, W.L. (Editors). Austrian Computer Society Book Series Vol. 87, Vienna, Austria, 1996. pp375-380.
- Petrie, H., Morley, S., McNally, P., O'Neill, A. & Majoe, D. (1997)
- “Initial design and evaluation of an interface to hypermedia systems for blind users.” Proceedings of the eighth ACM conference on Hypertext. Bernstein, M., Østerbye, K. & Carr, L. (Editors) Southampton, UK. ACM Press, New York, USA. pp48-56.
- Petrie, H., Schlieder, C., Blenkhorn, P, Evans, D.G., King, A., O'Neill, A., Ioannidis, G.T., Gallagher, B., Crombie, D., Mager, R. & Alafaci, M. (2002)
- “TeDUB: A System for Presenting and Exploring Technical Drawings for Blind People.” Computers Helping People with Special Needs, 8th International Conference, ICCHP 2002, Linz, Austria, July 15-20, Proceedings. Miesenberger, K., Klaus, J. & Zagler, W.L. (Editors) Lecture Notes in Computer Science Vol. 2398. Springer, Berlin, Germany, 2002. pp 537-539.
- Petrucci, L., Harth, E., Roth, P., Assimacopoulos, A. & Pun, T. (2000)
- “WebSound: a generic Web sonification tool allowing HCI researchers to dynamically create new access modalities.” CHI '00 extended abstracts on Human factors in computing systems. ACM Press, New York, USA.
- Pirolli, P. & Card, S.K. (1999)
- “Information foraging.” Psychological Review. Vol. 106, 1999, pp643-675.
- Pontelli, E., Gillan, D., Xiong, W., Saad, E., Gupta, G. & Karshmer, A.I. (2002)
- “Navigation of HTML tables, frames and XML fragments.” Assets '02: Proceedings of the fifth international ACM conference on Assistive technologies. Edinburgh, UK. ACM Press, New York, USA, 2002. pp25-32.
- Project Gutenberg (2004)
- “Project Gutenberg.” Available online at http://www.gutenberg.org. Viewed September 2004.
- Raggett, D., Le Hors, A. & Jacobs, I. (1999)
- “HTML 4.01 Specification.” Available online at http://www.w3.org/TR/html4/. Viewed November 2004.
- Ramakrishnan, I.V., Stent, A. & Yang, G. (2004)
- “HearSay: Enabling Audio Browsing on Hypertext Content.” WWW '04: Proceedings of the 13th international conference on World Wide Web. ACM Press, New York, USA. pp80-89.
- Raman, T.V. (1996)
- Conference companion on Human factors in computing systems: common ground. (CHI’96) Vancouver, British Columbia, Canada. ACM Press, New York, USA, 1996. Online - Ramen 1996 pp66-71.
- Raman, T.V. (2004)
- “Emacspeak – the complete audio desktop.” Available online at http://www.cs.cornell.edu/Info/People/raman/emacspeak/emacspeak.html. Viewed December 2004.
- Ramloll, R., Yu, W., Brewster, S., Riedel, B., Burton, M. & Dimigen, G. (2000)
- “Constructing sonified haptic line graphs for the blind student.” Assets '00: Proceedings of the fourth international ACM conference on Assistive technologies. Tremaine, M., Cole, E. & Mynatt, E. (Editors) Arlington, Virginia, USA. ACM Press, New York, USA, 2000. pp17-25.
- Ramsay, A.I.G. & Petrie, H. (2000)
- “The Tactile Depiction of Visual Conventions: The Advantage of Explicit Cues.” British Journal of Visual Impairment. Vol. 18(1), 2000, pp7-15.
- Ramstein, C. & Hayward, V. (1994)
- “The Pantograph: a large workspace haptic device for multi-modal HCI.” CHI ‘94: Proceedings of the SIGCHI conference on Human factors in computing systems. Adelson, B., Dumais, S. & Olson, J. (Editors) Boston, Massachusetts, USA. ACM Press, New York, USA, 1994. pp 57-58.
- Real (2004)
- “Real.com RealOne Player is now RealPlayer.” Available online at http://uk.real.com/playerplus/. Viewed August 2004.
- RNIB (2004a)
- “RNIB Internet HomePage.” Available online at http://www.rnib.org.uk. Viewed November 2004.
- RNIB (2004b)
- “Common technical queries about the design of this site.” Available online at http://www.rnib.org.uk/xpedio/groups/public/documents/PublicWebsite/public_techqa.hcsp. Viewed August 2004.
- RNIB (2004c)
- “The Disability Discrimination Act.” Available online at http://www.rnib.org.uk/xpedio/groups/public/documents/PublicWebsite/public_legaldda.hcsp. Viewed December 2004.
- RNIB (2004d)
- “Common technical queries about the design of this site.” Available online at http://www.rnib.org.uk/xpedio/groups/public/documents/PublicWebsite/public_techqa.hcsp. Viewed November 2004.
- RNIB (2004d)
- “Adobe Acrobat PDFs – Web access centre.” Available online at Reference - RNIB 2004b. Viewed August 2004.
- Rotard, M. & Ertl, T. (2004)
- “Tactile Access to Scalable Vector Graphics for People with Visual Impairment.” SVG Open 2004 Conference, Tokyo, Japan. 7-10 September 2004. Available online at http://www.svgopen.org/2004/papers/TactileAccessToSVG/#S2. Viewed December 2004.
- Roth, P., Petrucci, L., Assimacopoulos, A. & Pun, T. (1998)
- “AB-Web: Active audio browser for visually impaired and blind users.” The Fifth International Conference on Auditory Display (ICAD98), Glasgow, U.K. Available online at http://www.icad.org/websiteV2.0/Conferences/ICAD98/papers/ROTHL.PDF. Viewed December 2004.
- Roth, P., Richoz, D., Petrucci, L. & Pun, T. (2001)
- “An Audio-Haptic Tool For Non-Visual Image Representation.” ISSPA 2001, International Conference on Human-Computer Interaction (Special Session: Enhanced user interfaces for non-visual image display) Kuala Lumpur, Malaysia. August 2001. Available online at http://www3.psychologie.hu-berlin.de/ingpsy/People/p_roth/pub/ISSPA.pdf. Viewed December 2004.
- Rubin, J. (1994)
- “Handbook of Usability Testing.” John Wiley & Sons, New York, USA.
- Saitek (2004)
- “Cyborg Force Feedback Stick.” Available online at http://www.saitek.com/uk/prod/cyborg_force.htm. Viewed August 2004.
- Savidis, A. & Stephanidis, C. (1995)
- “Building non-visual interaction through the development of the Rooms metaphor.” Proceedings of the SIGCHI conference on Human factors in computing systems. (CHI’95) Katz, I.R., Mack, R., Marks, L., Rosson, M.B. & Nielsen, J. (Editors) Denver, Colorado, USA. ACM Press/Addison-Wesley Publishing Co., New York, USA. pp 24-25.
- Scapin, D., Leulier, C., Vanderdonckt, J., Mariage, C., Bastien, C., Farenc, C., Palanque, P. & Bastide, R. (2000)
- “A Framework for Organizing Web Usability Guidelines.” Proceedings of the 6th Conference on Human Factors and the Web, Austin, TX, June 2000. Available online at http://www.tri.sbc.com/hfweb/scapin/Scapin.html. Viewed December 2004.
- Schickler, A.M., Mazer, S.M. & Brooks, C. (1996)
- “Pan-browser support for annotations and other meta-information on the World Wide Web.” Computer Networks and ISDN Systems. Vol. 28, No.7-11, May 1996. pp1063-1074.
- Schneider, J. & Strothotte, T. (2000)
- “Constructive Exploration of Spatial Information by Blind Users.” Assets '00: Proceedings of the fourth international ACM conference on Assistive technologies. Tremaine, M., Cole, E. & Mynatt, E. (Editors) Arlington, Virginia, USA. ACM Press, New York, USA, 2000. pp188-192.
- Schroeder, W. (1998)
- “Testing Web Sites with Eye-Tracking.” Available online at http://www.uie.com/articles/eye_tracking/. Accessed May 2004.
- Schwerdtfeger, R.S. (1991)
- “Making the GUI talk.” BYTE. December 1991, pp 118-128.
- SciVisum (2004)
- “Web Accessibility Report.” Available online at http://www.scivisum.co.uk/report/accessibility/. Viewed December 2004.
- SearchEngineWatch (2004)
- “Nielsen NetRatings Search Engine Ratings.” Available online at http://www.searchenginewatch.com/reports/article.php/2156451. Accessed August 2004.
- Sekuler, R. & Blake, R. (1994)
- “Perception, Third Edition.” McGraw-Hill Book Company, Singapore, 1994.
- SeebyTouch (2004)
- “SeebyTouch.” Available online at http://see-by-touch.sourceforge.net/index_.html. Viewed December 2004.
- Sensable Technologies (2004)
- “Products: PHANTOM devices.” Available online at http://www.sensable.com/products/phantom_ghost/phantom.asp. Viewed August 2004.
- Serra, F. (2004)
- “Mozilla Amazon Browser.” Available online at http://www.faser.net/mab/. Viewed November 2004.
- SETI Search (2001)
- “SETI: Search Engine Technology Interface.” Available online at http://seti-search.com/, 2001, now available through WaybackMachine.org.
- Shneiderman, B. & Hochheiser, H. (2001)
- “Universal Usability as a Stimulus to Advanced Interface Design.” Behaviour and Information Technology. Vol. 20(5) Sept-Oct. pp367-376.
- Sinclair, R. (2000)
- “Microsoft Active Accessibility: Architecture.” Available online at http://msdn.microsoft.com/library/en-us/dnacc/html/actvaccess.asp. Viewed August 2004.
- Sjöström, C. (2001)
- “Using Haptics in Computer Interfaces for Blind People.” CHI ‘01 extended abstracts on Human factors in computing systems. Seattle, Washington, USA. ACM Press, New York, USA, 2001. pp245-246.
- Smith, J.B. & Weiss, S.F. (1988)
- “Hypertext.” Communications of the ACM. July 1988, Vol. 31 No.7, pp816-819.
- Solso, R.L. (1995)
- “Cognitive Psychology (4th Edition).” Allyn and Bacon, Needham Heights, Massachusetts, USA, 1995.
- de Souza. F. & Bevan, N. (1990)
- “The Use of Guidelines in Menu Interface Design: Evaluation of a Draft Standard.” Proceedings of the Third IFIP TC13 Conference on Human-Computer Interaction. Cockton, G., Diaper, D. & Shackel , B. (Editors) Cambridge, UK. Elsevier Science Publishers, Amsterdam, The Netherlands. pp435-440.
- Srinivasan, M.A. & Basgodan, C. (1997)
- “Haptics in virtual environments: Taxonomy, Research Status, and Challenges.” Computer Graphics. Vol. 4(21) pp393-404.
- Stevens, R.D. & Edwards, A.D.N. (1994)
- “MathTalk: usable access to mathematics.” Information Technology and Disabilities. Vol. 1(4) 1994.
- Stevens, R.D., Wright, P.C., Edwards, A.D.N. & Brewster, S.A. (1996)
- “An audio glance at syntactic structure based on spoken form.” Interdisciplinary aspects on computers helping people with special needs, ICCHP’96 Linz, Austria. Klaus, J., Auff, E., Kremser, W., & Zagler, W.L. (Editors). Austrian Computer Society Book Series Vol. 87, Vienna, Austria, 1996. pp 599 - 607.
- Sullivan, D. (2003)
- “Web Directory Sizes.” Available online at http://searchenginewatch.com/reports/article.php/2156411. Viewed August 2004.
- Sullivan, T. & Matson, R. (2000)
- “Barriers to use: usability and content accessibility on the web's most popular sites.” CUU '00: Proceedings on the 2000 conference on Universal Usability. Arlington, Virginia, USA. ACM Press, New York, USA, 2000. pp139-144.
- Sun (2004a)
- “Accessibility.” Available online at http://java.sun.com/products/jfc/accessibility/index.jsp. Viewed December 2004.
- Sun (2004b)
- “Applets.” Available online at http://java.sun.com/applets/. Viewed August 2004.
- TAEVIS (2002)
- “TAEVIS Tactile Diagram Manual.” Purdue University, West Lafayette, Illinois, USA. Available online at http://www.taevisonline.purdue.edu/Training/Tactile_Diagram_Manual_PRINT.PDF. Viewed April 2004.
- Takagi, H. & Asakawa, C. (2000)
- “Transcoding proxy for nonvisual web access.” Assets '00: Proceedings of the fourth international ACM conference on Assistive technologies. Tremaine, M., Cole, E. & Mynatt, E. (Editors) Arlington, Virginia, USA. ACM Press, New York, USA, 2000. pp164-171.
- Takagi, H., Asakawa, C., Fukuda, K. & Maeda, J. (2002)
- “Site-wide Annotation: Reconstructing Existing Pages to be Accessible.” Assets '02: Proceedings of the fifth international ACM conference on Assistive technologies. Edinburgh, UK. ACM Press, New York, USA, 2002. pp81-88.
- Tashian, Carl (2000)
- “Bytes and Pixels.” Available online at http://www.tashian.com/htmlguide/sizes.html. Viewed September 2004.
- Tauscher, L. & Greenberg, S. (1997)
- “How people revisit web pages: empirical findings and implications for the design of history systems.” International Journal of Human-Computer Studies. Vol. 47(1) July 1997. pp97-137.
- TeDUB Project (2004)
- “TeDUB.” Available online at http://www.tedub.org. Viewed November 2004.
- TGD (2004)
- “Tactile Designer Graphics.” Available online at http://www.tactileaudio.com.au/first.htm. Viewed June 2004.
- TheCounter.com (2004)
- “JavaScript Stats.” Available online at http://www.thecounter.com/stats/2004/July/javas.php. Viewed July 2004.
- Tiresias (2004)
- “Web Browsers for Non-Visual Output.” Available online at http://www.tiresias.org/equipment/eb26.htm. Viewed November 2004.
- TNAUK (2004)
- “Talking Newspaper Association of the United Kingdom.” Available online at http://www.tnauk.org.uk/. Viewed December 2004.
- Touch Graphics (2004)
- “The Talking Tactile Tablet.” Available online at http://touchgraphics.com/ttt.htm. Viewed December 2004.
- Treviranus, J., McCathieNevile, C., Jacobs, I. & Richards, J. (2000)
- “Authoring Tool Accessibility Guidelines 1.0.” Available online at http://www.w3.org/TR/WAI-AUTOOLS/. Viewed December 2004.
- Tripod (2004)
- “Tripod.” Available online at http://www.tripod.lycos.com/. Viewed September 2004.
- Truillet, P., Vigouroux, N. & Oriola, B. (1998)
- “A Friendly Document Reader by use of Multimodality” Technology and Persons with Disabilities Conference (CSUN) 1998. Northridge, California, USA. Available online at http://www.csun.edu/cod/conf/1998/proceedings/csun98_095.htm. Viewed December 2004.
- Ungar, S., Blades, M. & Spencer, C. (1996)
- “The Ability of Visually Impaired Children to Locate Themselves on a Tactile Map.” Journal of Visual Impairment and Blindness. November - December 1996, pp526-535.
- Ungar, S., Blades, M. & Spencer, C. (1997)
- “Teaching Visually Impaired Children to Make Distance Judgements from a Tactile Map.” Journal of Visual Impairment and Blindness. March-April 1997, pp163-174.
- Unicode (2004)
- “The Unicode Standard.” Available online at http://www.unicode.org/standard/standard.html. Viewed August 2004.
- US-CERT (2004)
- “Critical Vulnerabilities in Microsoft Windows.” Available online at http://www.us-cert.gov/cas/techalerts/TA04-212A.html. 30 July 2004. Viewed August 2004.
- UsableNet (2004a)
- “Lift Online.” Available online at http://www.usablenet.com/products_services/lift_online/lift_online.html. Viewed December 2004.
- UsableNet (2004b)
- “LIFT Text Transcoder.” Available online at http://www.usablenet.com/products_services/text_transcoder/text_transcoder.html. Viewed November 2004.
- VirTouch (2004)
- “VTPlayer.” Available online at http://www.virtouch2.com/index.htm. Viewed December 2004.
- Vitense, H.S., Jacko, J.A. & Emery, V.K. (2002)
- “Multimodal Feedback: Establishing a performance baseline for improved access by individuals with visual impairments.” Assets '02: Proceedings of the fifth international ACM conference on Assistive technologies. Edinburgh, UK. ACM Press, New York, USA, 2002. pp49-56.
- Vorburger, M. (1999)
- “ALTifier Web Accessibility Enhancement Tool.” Available online at http://www.vorburger.ch/projects/alt/. Viewed December 2004.
- W3C (2004a)
- “The World-Wide-Web Consortium.” Available online at: http://www.w3.org. Viewed November 2004.
- W3C (2004b)
- “W3C Web Accessibility Initiative Statement on Web Access Report from UK Disability Rights Commission.” Available online at http://www.w3.org/2004/04/wai-drc-statement.html. Viewed November 2004.
- W3C (2004c)
- “Document Object Model (DOM) Technical Reports.” Available online at http://www.w3.org/DOM/DOMTR. Viewed August 2004.
- Watchfire Corporation (2004)
- “About Bobby.” Available online at: http://bobby.watchfire.com/bobby/html/en/about.jsp. Viewed September 2004.
- Watters, C. & MacKay, B. (2004)
- “Transformation Volatility and the Gateway Model for Web Page Migration to Small Screen Devices.” Proceedings of the 37th Hawaii International Conference on System Sciences (HICSS’04), Sprague, R.H (Editor) Big Island, Hawaii, USA. IEEE Computer Society Press, 2004.
- WAVE (2004)
- “WAVE 3.0 Accessibility Tool.” Available online at: http://wave.webaim.org/index.jsp. Viewed October 2004.
- WebAIM (2004)
- “Creating Accessible Images.” Section 5.5.2.1 “Decorative images.” Available online at http://www.webaim.org/techniques/images/5#null. Viewed August 2004.
- WebCleaner (2004)
- “WebCleaner filtering proxy server.” Available online at http://freshmeat.net/projects/Webcleaner/. Viewed February 2004
- Weber, G., Petrie, H., & Mager, R. (1996)
- “Access to MS Windows for Blind Users.” Interdisciplinary aspects on computers helping people with special needs, ICCHP’96 Linz, Austria. Klaus, J., Auff, E., Kremser, W., & Zagler, W.L. (Editors). Austrian Computer Society Book Series Vol. 87, Vienna, Austria, 1996. pp 31–33.
- WebFormator (2004)
- “WebFormator web browser.” Available online at http://www.webformator.de/index.html. Viewed May 2004.
- Wellman, P.S., Peine, W.J., Favalora, G.E. & Howe, R.D. (1997)
- “Mechanical design and control of a high-bandwidth shape memory alloy tactile display.” Lecture Notes in Computer Science Vol. 232. Casals, A. & de Almeida A.T. (Editors) Springer, 1998. pp56-66.
- WestCiv (2004)
- “Browser support.” Available online at http://www.westciv.com/style_master/academy/browser_support/index.html. Viewed November 2004.
- Wickens, C.D. (1992)
- “Engineering Psychology and Human Performance.” HarperCollins, New York, USA.
- Wild, G., Hinton, D. & Hinton, R. (1997)
- “The design of microcapsule diagrams for visually impaired students on distance learning courses.” British Journal of Visual Impairment. Vol. 15(1) 1997. pp23-27
- Winer, D. (2004)
- “RSS 2.0 Specification.” Available online at http://blogs.law.harvard.edu/tech/rss. Viewed December 2004.
- Woodbury Associates (2004)
- “UniToolbox – Controls for Unicode development in Visual Basic.” Available online at http://www.unitoolbox.com/. Viewed August 2004.
- Wyatt, H.J., Hall, E.C. & Engber, K. (2000)
- “Representation of simple graphs in virtual tactile space.” Journal of Visual Impairment and Blindness. November 2000, pp713-716
- Yahoo! Mail (2004a)
- “Yahoo Mail.” Available online at http://mail.yahoo.com. Viewed November 2004.
- Yahoo! (2004b)
- “Yahoo Features.” Available online at http://docs.yahoo.com/docs/info/features.html. Viewed September 2004.
- Yee, K. (2003)
- “Shodouka.” Available online at http://web.shodouka.com through http://www.waybackmachine.org. Visited March 2003.
- Yu, W. & Brewster, S. (2002)
- “Multimodal Virtual Reality Versus Printed Medium in Visualization for Blind People.” Assets '02: Proceedings of the fifth international ACM conference on Assistive technologies. Edinburgh, UK. ACM Press, New York, USA, 2002. pp57-64.
- Zajicek, M. & Powell, C. (1997)
- “Building a conceptual model of the World-Wide-Web for visually impaired users.” Proceedings of Contemporary Ergonomics. Grantham, U.K. Taylor & Francis, London, 1997. pp270-175.
- Zajicek, M., Powell C. & C. Reeves (1998)
- “A Web Navigation Tool for the Blind.” Assets '98: Proceedings of the third international ACM conference on Assistive technologies. Blattner, M.M. & Karshmer, A.I. (Editors) Marina del Rey, California, USA. ACM Press, New York, USA, 1998. pp204-206.
- Zellweger, P.T., Chang, B-W. & Mackinlay, J.D. (1998)
- “Fluid Links for Informed and Incremental Link Transitions.” Proceedings of the ninth ACM conference on Hypertext and hypermedia : links, objects, time and space—structure in hypermedia systems: links, objects, time and space—structure in hypermedia systems. Pittsburgh, Pennsylvania , USA. ACM Press, New York, USA. pp50-57.
- Zhang, J. & Norman, D.A. (1994)
- “Representations in Distributed Cognitive tasks.” Cognitive Science. Vol. 18, 1994. pp87-122.
- Zona Research (2001)
- “The Need for Speed II.” Available online at http://www.keynote.com/downloads/Zona_Need_For_Speed.pdf. Viewed September 2004.
Appendix 1: HTML Elements supported by WebbIE
The following table indicates the level of support WebbIE gives to HTML 4.01 elements. This is the most modern W3C HTML standard: while superseded by XHTML, XHTML is essentially HTML plus mandatory XML validation.
Support is defined in three classifications:
· Full This element is fully supported in WebbIE, generally in compliance with the HTML specification.
· Visual This element conveys visual formatting information that is not conveyed in WebbIE. This is generally because the extra cognitive load required by the user to process the additional information provided in text is believed not to cost-effective for the user, so WebbIE does not attempt to convey it. In the case of elements with text content, such as ABBR, the text content is correctly conveyed to the user.
· Unsupported This element is not supported in WebbIE.
Name | Description | Support in WebbIE [Notes] |
A | Anchor | Full |
ABBR | abbreviated form (e.g., WWW, HTTP, etc.) | Visual |
ACRONYM | abbreviated form (e.g., WWW, HTTP, etc.) | Visual |
ADDRESS | information on author | Visual |
APPLET | Java applet | Full [1] |
AREA | client-side image map area | Full |
B | bold text style | Visual |
BASE | document base URI | Full |
BASEFONT | base font size | Visual |
BDO | I18N BiDi over-ride | Full |
BIG | large text style | Visual |
BLOCKQUOTE | long quotation | Full [2] |
BODY | document body | Full |
BR | forced line break | Full [3] |
BUTTON | push button | Full |
CAPTION | table caption | Full |
CENTER | shorthand for DIV align=center | Visual |
CITE | citation | Visual |
CODE | computer code fragment | Visual |
COL | table column | Unsupported [4] |
COLGROUP | table column group | Unsupported [4] |
DD | definition description | Full |
DEL | deleted text | Full [5] |
DFN | instance definition | Visual |
DIR | directory list | Visual |
DIV | generic language/style container | Visual |
DL | definition list | Full |
DT | definition term | Full |
EM | emphasis | Visual [6] |
FIELDSET | form control group | Unsupported [7] |
FONT | local change to font | Visual |
FORM | interactive form | Full |
FRAME | subwindow | Full |
FRAMESET | window subdivision | Full |
H1 | heading | Full |
H2 | heading | Visual [8] |
H3 | heading | Visual [8] |
H4 | heading | Visual [8] |
H5 | heading | Visual [8] |
H6 | heading | Visual [8] |
HEAD | document head | Full |
HR | horizontal rule | Full |
HTML | document root element | Full |
I | italic text style | Visual |
IFRAME | inline subwindow | Full [9] |
IMG | Embedded image | Full |
INPUT | form control | Full |
INS | inserted text | Visual [10] |
ISINDEX | single line prompt | Full |
KBD | text to be entered by the user | Visual |
LABEL | form field label text | Full |
LEGEND | fieldset legend | Unsupported [7] |
LI | list item | Full |
LINK | a media-independent link | Unsupported [11] |
MAP | client-side image map | Full |
MENU | menu list | Full |
META | generic metainformation | Full |
NOFRAMES | alternate content container for non frame-based rendering | Unsupported [12] |
NOSCRIPT | alternate content container for non script-based rendering | Unsupported [13] |
OBJECT | generic embedded object | Full [1] |
OL | ordered list | Full |
OPTGROUP | option group | Unsupported [4] |
OPTION | selectable choice | Full |
P | paragraph | Full |
PARAM | named property value | Full [1] |
PRE | preformatted text | Visual |
Q | short inline quotation | Full [2] |
S | strike-through text style | Visual |
SAMP | sample program output, scripts, etc. | Visual |
SCRIPT | script statements | Unsupported [14] |
SELECT | option selector | Full |
SMALL | small text style | Visual |
SPAN | generic language/style container | Visual |
STRIKE | strike-through text | Visual |
STRONG | strong emphasis | Visual [6] |
STYLE | style info | Visual |
SUB | subscript | Visual |
SUP | superscript | Visual |
TABLE |
| Visual |
TBODY | table body | Visual |
TD | table data cell | Visual |
TEXTAREA | multi-line text field | Full |
TFOOT | table footer | Visual |
TH | table header cell | Visual |
THEAD | table header | Visual |
TITLE | document title | Full |
TR | table row | Visual |
TT | teletype or monospaced text style | Visual |
U | underlined text style | Visual |
UL | unordered list | Full |
VAR | instance of a variable or program argument | Visual |
Notes on the elements:
1. Launched in separate window. Usability depends on the screen-reader-friendliness of the embedded content.
2. WebbIE places quotation marks at the beginning and end. This same approach could have been employed for elements such as EM or STRONG. For example, “really” might have been rendered as “*really*”.
3. User may choose whether to show dividing lines (lines of underline characters in WebbIE) or suppress them.
4. These are table elements intended to help structure the contents and improve accessibility. They are used so rarely they are not supported.
5. The content of the element is not displayed.
6. These elements would be strong contenders for implementation in a self-voicing web browser, since their import could be conveyed by prosody without getting in the way of the use of the application by adding extraneous words.
7. Accessibility features of forms not implemented because they are so infrequently used.
8. Infrequently used, and when used, not used to structure the document text.
9. Handled as normal frames. The frame rendered in the linear text display is not implanted at the position of the IFRAME element in the hosting document, but follows it. This may lead to confusion, depending on the context.
10. Features allowing the use of HTML as a document creation and tracking tool (for collaborative working) might be of interest in a content creation system using HTML as the document format. As a powerful text format with many native accessibility features, it may be of use in applications for blind people. However, they are not used generally.
11. Used in the header section of a web page to link to style sheets. In theory, LINK could be used to structure whole web pages with explicit links between sections (e.g. contact page, legal page) but in practice these are not employed.
12. WebbIE supports frames, so does not display this element.
13. WebbIE supports some JavaScript. It might be of use to support the NOSCRIPT element in conjunction with the limited JavaScript support, but the DOM does not deliver the NOSCRIPT element if support for scripting is turned on in Internet Explorer. Turning off scripting often results in page that tells the user that they must have scripting enabled to use the site, in contravention of usability guidelines.
14. WebbIE supports JavaScript through interaction with the DOM, not through performing any script processing itself.
Appendix 2: Websites used for evaluation
Randomly-selected websites
www.stakeout.com/
www.computer-network-security.com/
www.logo-design-logo-design.com/
www.atimeshare.com/
www.wtve.com/
www.beardsmoregallery.com/
www.intervalve.nl/
www.greenwichhomemortgage.com/
www.nipp.com/
www.goldenstarhotel.gr/
www.dfreeman.com.au/
muses.muses.tottori-u.ac.jp/jica/index.html
www.pc.gc.ca/pn-np/sk/grasslands/index_E.asp
holocaustcenter.org/
www.hvfs.com.au/hvfs_v3/
www.kridel.com/
www.michaelskitchen.com/
www.punchline.com/
www.snetworking.com/
www.owmnahar.com/owm/
www.north.ecasd.k12.wi.us/
vieclam.tripod.com/
www.faziomarketing.com/
www.juergensdentkraft.com/
www.waltoncountychamber.com/
www.wellesley.edu/PublicAffairs/Commencement/1990/gorbachev.html
www.shencofair.com/
www.myrnabloom.com/
www.hd.com.br/terrafirme/
www.trainbrain.com/
www.gearsandpinions.com/
www.sumos.com.my/
www.idesk.com/
www.lamps-shades.com/
www.advancedrealty.net/
www.finite.com.au/
palmbeach.no1hotels.net/
www.bundysugar.com.au/
www.cynthiarerko.com/
www.umanitoba.ca/faculties/science/delta_marsh/
www.guidance.net.au/
www.crystalinks.com/china.html
www.dierenambulance-haarlem.nl/
www.hydonline.com/
www.thegoldenfleece.com/
www.romacon.nl/
www.adnet.ie/xpress/
www.biscaynemotel.com/
www.4rk9s.com/
www.altusmortgage.com/
www.netcomdesign.com/
www.siemensmobilephoneclub.com/
www.millionauto.com/
www.india-toursinfo.com/
www.sttropezlasvegas.com/
www.jewishgates.org/
www.mergrande.com/
www.warbirdart.com/
www.library.drexel.edu/
www.laboriqua.com/
www.zion-lcms.net/
www.exatech.fr/
www.abracadabramurals.com/
www.crg-hrdev.com/
www.sweetys-candy.com/
www.goodshepherdelca.org/
www.etosha.com/mushara.htm
www.wffj.org/
www.cheaphosting.net.nz/
www.chartered-accountants.co.uk/mather/
www.genesisconsult.com/
uk.geocities.com/lauraadolfsson/
www.kargah.com/
www.realestate-4u.com/
home.comcast.net/~starrite/
www.superjobsearch.com/
www.sainsbury-heating.com/
www.arubalions.org/
www.hotel-prestige.cz/
www.worldexecutive.com/cityguides/sydney/index.html
www.lakeviewhotel.com/
www.access-hitech.com/
vermontaaa.tripod.com/
www.astutemedia.com/
www.orcg.com/
www.usatoday.com/sports/college/mensbasketball/independents/ndakotastate.htm
www.spfld-mo-chamber.com/
www.madisonavenuepub.com/madisonsouth/
members.aol.com/CreatArtTC/
www.allitalyhotel.com/
www.dolphinplace.com/
www.ardilaunhousehotel.ie/
www.photoquest.com.sg/
www.co.clackamas.or.us/fair/
www.experiencela.com/
www.ahavasisraelgr.org/
www.jtcw.com.au/
www.tasregionalarts.asn.au/
www.khrfuneralhomes.com/
www.baguiocityonline.com/
www.halophyte.org/
www.dixiebass.com/dixiebass/
www.aunline.com/
www.arrowblinds.com/
www.californiabungee.com/
www.alaskavacations.com/
www.volunteercostarica.com/
www.bluecrossarena.com/
www.east-tawas.com/
www.preciousplaces.com/
www.efc.dcccd.edu/
www.sandysellsflorida.com/
www.sirwilliamrussellflint.co.uk/
www.nireland.com/ballymacwardps/
Selected websites
www.barclays.co.uk/
www.co-operativebank.co.uk/
www.halifax.co.uk/home/index.shtml
www.lloydstsb.com/
www.nationwide.co.uk/default.htm
access.adobe.com/
webxact.watchfire.com/
www.ability.org.uk/
www.acb.org/
www.afb.org/
www.bcab.org.uk/
www.blind.net/blindind.htm
www.blind.org.uk/
www.freedomscientific.com/
www.guidedogs.org.uk/
www.nbcs.org.uk/
www.nfb.org/
www.rlsb.org.uk/
www.rncb.ac.uk/
www.rnib.org.uk/
www.screenreader.co.uk/
www.wcb-ccd.org.uk/
www.amazon.co.uk/
www.ebay.co.uk
www.argos.co.uk/static/Home.htm
www.kelkoo.co.uk/
www.sainsburys.co.uk/home.htm
www.tesco.com/
slashdot.org/
www.blogger.com/start
www.friendsreunited.co.uk/
www.livejournal.com/
www.metafilter.com/
uk.mcafee.com/
windowsupdate.microsoft.com/
www.microsoft.com/
www.symantec.com/index.htm
www.w3.org/
www.cam.ac.uk/
www.manchester.ac.uk/
www.mgs.org/
www.allmusic.com/
www.melbourne2006.com.au/
www.familysearch.org/
www.manutd.com/
www.rhs.org.uk/
www.theonion.com/content/index
www.weightwatchers.co.uk/
www.cabinetoffice.gov.uk/e-government/
www.dfes.gov.uk/
www.dwp.gov.uk/
www.hmrc.gov.uk/
www.manchester.gov.uk/
www.nhs.uk/
www.nhsdirect.nhs.uk/
www.nih.gov/
www.parliament.uk/
news.bbc.co.uk/
www.bbc.co.uk/radio4/progs/listenagain.shtml
www.bbc.co.uk/weather/
www.channel4.com/
www.manchesteronline.co.uk/entertainment/
www.cnn.com/
www.dailymail.co.uk/
www.dailyrecord.co.uk/
www.economist.com/index.html
news.ft.com/home/uk
www.guardian.co.uk/
www.independent.co.uk/
www.itv.com/
www.manchesteronline.co.uk/
www.mirror.co.uk/
www.msnbc.msn.com/
www.newscientist.com/home.ns
www.newstatesman.com/
www.nytimes.com/
www.sciencedirect.com/
www.scotsman.com/
www.theherald.co.uk/
www.thesun.co.uk/
www.timesonline.co.uk/uk/
www.thisislondon.co.uk/
www.timeout.com/london/
dictionary.reference.com/
en.wikipedia.org/wiki/Main_Page
encarta.msn.com/
www.archive.org/
www.cia.gov/cia/publications/factbook/index.html
www.gutenberg.org/
www.howstuffworks.com/
www.imdb.com/
search.msn.com/
search.yahoo.com/
uk.ask.com/?o=312
mail.yahoo.co.uk
www.hotmail.com
www.monster.co.uk/
www.royalmail.com/portal/rm
www.lastminute.com/site/
www.tfl.gov.uk/tube/
www.easyjet.com/en/book/index.asp
www.expedia.co.uk/default.aspx
www.hotels.co.uk/
www.nationalexpress.com/
www.nationalrail.co.uk/
www.ryanair.com/site/EN/
www.thetrainline.com/
www.travelocity.co.uk/
www.bt.com/index.jsp
www.unitedutilities.co.uk
Footnotes
[1] The word “semantics” has different meanings in different fields: in this thesis and generally in accessibility, especially web accessibility, it means the attributes and role of a piece of text, for example “this is emphasised and important” or “this is a headline”.
[2] Direct vision substitution systems for blind people are still very experimental, after years of attempts, and will not be considered here as practical solutions: however, it should be noted that they all demonstrate some ability by blind people to appreciate spatial information through an audio or haptic interface (Bach-y-Rita et al., 1969; Bach-y-Rita et al., 1998; Maucher et al., 2000; Meijer, 1992; Ramstein and Hayward, 1994; Kawai and Tomita, 2001).
[3] Braille documents use layout, such as centring or indenting on the page to indicate headings and chapters (Alternative Media Guide, 2000).
[4] The theory of information foraging has informed some proposed browsing improvements for sighted people, however (e.g. Olston and Chi, 2003).
[5] Tactile diagrams, tactile representations of pictorial information sources defined above as one of the domains under investigation, should not be confused with tactile pictures (also known as haptic pictures and tactual pictures) described in Kennedy (1982). These are tactile representations of a picture as it would be seen by a sighted person – for example, a picture of a tree or a face. The usefulness of tactile pictures is contentious and outside the scope of this work. Berla (1982) describes some of the deep issues surrounding this topic.
[6] It is possible to use the tactile tablet as a spatialised interface to allow a large area to be accessed through touch: Challis and Edwards (2000) is one example. This does ask a great deal of the user.
[7] Barnicle (2000) describes how screen reader users struggled to use a GUI: the use of non-standard GUI components by application designers was a significant problem.
[8] Screen-readers do retain the ability to move a pointer around the screen to explore it, but they do not attempt to provide information on the appearance or location of GUI items.
[9] The author was responsible for the design and implementation of the re-presentation of the diagram content: the process of taking the result of image analysis from a project partner or working directly with the output of a software engineering tool and the user interface developed to re-present to a blind user. This was then evaluated exclusively by the other project partners, who decided on the methodology and carried out the evaluations. Their conclusions from the evaluation are presented in the descriptions of each interface and the author’s conclusions presented in the summary at the end of this chapter.
[10] The user group TeDUB project partners were in Ireland (the National Council for the Blind in Ireland, http://www.ncbi.ie/), the Netherlands (FNB, http://www.fnb.nl) and Italy (Unione Italiana Ciechi, http://www.uiciechi.it/). The Centre for HCI Design is based in City University, London (http://www-hcid.soi.city.ac.uk/)
[11] Self-voicing also denies Braille users their normal way of interacting with the computer and their normal strategies and skills.
[12] Motif and motive are both used in the literature.
[13] Of course, the HTML title element has been used to good effect, and the browser clearly displays the page title “BBC News | News Front Page”, but this title is often repeated across a whole website rather than changed to reflect the page contents.
[14] Braille users are in a slightly different position, in that they can move back and forth through a given line: however, they can still only address a tiny proportion of the whole page at any one time, so are in effect limited to a linear route through the document.
[15] If the web designer uses the LABEL element correctly and the user’s web browser supports it, this problem will not occur: this is unlikely.
[16] Attempts have been made to depict large databases through a visual presentation, such as Ahlberg and Shneiderman (1994). However, the Web is uniquely huge and search engines are perhaps the best solution.
[17] Aural style sheets are supported by SpeakThis (Fonix, 2004) and Emacspeaks (Raman, 2004).
[18] Other scripting languages are available, such as Microsoft’s VBScript (Microsoft, 2004c), but JavaScript is the de facto standard.
[19] A further complication is legal: copyright law may dictate that some transformations breach the rights of the web designer, who holds the copyright on the page. Copyright is an unresolved legal issue and a complex one affecting many re-presentation techniques and services (Cavazos and Miles, 1997) but has not generally affected proxy services yet. Web servers can mark web pages with a “do not transform flag” and Hanson and Richards (2004) found that less than 0.01% of web pages did so.
[20] There is one more that will not be covered: creating an application that drives a Braille display, such as ‘HyperBraille’ (Kieninger, 1996).
[21] The principle is given in Blenkhorn and Evans, 2001, but originated with Tom Vincent, who is not referenced in Blenkhorn and Evans.
[22] WebbIE does not support History: this would be relatively easy, since it is available through the WebBrowser object, but fewer than 1% of sighted users use it (Tauscher and Greenberg, 1997).
[23] One blind user, who has since adopted WebbIE, would previously copy web pages in Internet Explorer using Select All, Copy, then Paste to transfer the pages into Microsoft Word where the presence of a caret made them accessible.
[24] Computing sites were included because they represent important sites for users (e.g. Microsoft Update, http://windowsupdate.microsoft.com) and because working with software is a relatively common profession for blind people.
[25] See Appendix 1 for a complete description of HTML 4.01 elements, supported or not supported by WebbIE.
[26] JAWS has a similar skip links function, which has similar results to WebbIE.
[27] Screen readers can also access the screen directly by intercepting the operating system writing to the screen: this is a low-level process that predates accessibility APIs, and requires enormous expertise. If the situation necessitates this approach, it had better be left to a proper screen reader.
[28] It also does not preclude re-presentation of XMI in different ways, for example producing linearised text versions in HTML for sighted people who are learning the symbolic and graphical notation. Different levels of annotation and explanation could be provided according to the progress of the users.